The cryptocurrency market has been experiencing significant volatility in recent days. Critical technical levels stand out, especially for Zcash (ZEC), Toncoin (TON) and Shiba Inu (SHIB). Both bullish momentum and short-term correction trends have increased uncertainty among investors.
ZEC is tested with technical indicators
Zcash tested the $680 region with its recent rapid rise. However, as intense selling pressure came into play at these levels, the price had difficulty holding on with upper wick candles. Technical indicators have signaled market fatigue, particularly with the RSI starting to decline after remaining at overbought levels for weeks. However, the price is still trading above its rising 20-day moving average and other major indicators. Recovery is also observed in the 50 and 100-day averages.
In periods where the rises are so steep, a correction is an expected situation. While the increase in volume attracted attention in the last rally, buyers’ appetite began to decrease as the price approached the old peaks. It is important for ZEC to hold on to the critical support zone between $600-620. If there is a retreat here, the 20-day average around $ 530 may come to the fore first, followed by the $ 430-450 band.
| Cryptocurrency | Critical Support Point | Major Moving Average |
|---|---|---|
| ZEC | $600–$620 | 20 days: $530 |
| TON | $1.75–$1.80 | 200 days: $1.75–$1.80 |
| SHIB | $0.00000540–$0.00000550 | 200 days: below |
Toncoin is at the critical limit
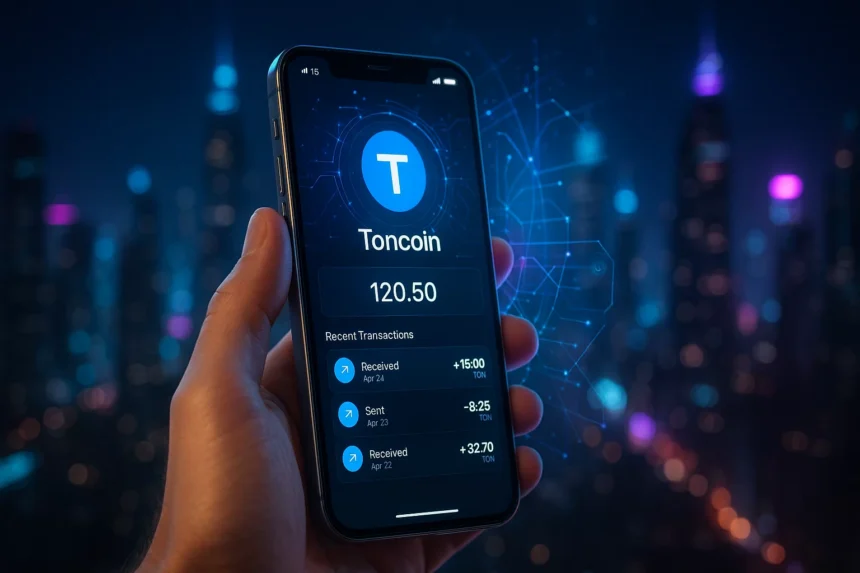
Toncoin approached $3 with a sharp rally in May; But immediately after this rise, it entered a rapid correction. Currently, the price is trying to hold on to the 200-day moving average in the $1.75-1.80 band. It is stated that this level has been critical in the past in determining the distinction between long-term decline and recovery.
It was observed that transaction volume and speculative movements were intense during the rally. However, as sales increased, both momentum and volume declined significantly. At the recent top, pressure increased as the RSI turned sharply from overbought. Still, the price remains above the 50- and 100-day averages; This shows that the general structure is not entirely negative.
According to market analysts, if persistence above the 200-day average is achieved, it is possible for the price to move back to the $ 2.40 level after a short-term consolidation. Otherwise, deeper corrections can be expected if the main support is lost.
Mini dictionary: Moving Average is a technical analysis indicator that helps determine the direction and current momentum of the trend by averaging the prices in a certain time period. Short- and long-term trends are analyzed using different time frames (e.g. 20, 50, 100, 200 days).
Thin appearance prevails in Shiba Inu
On the Shiba Inu front, the positive outlook gave way to a harsh sales wave in the short term. The gradual recovery that continued since March disappeared after breaking downwards from the short-term ascending channel. The price gave a negative technical signal by falling below its short-term averages and support trend.
It is suggested that a persistent hold of consecutive higher lows is important to maintain bullish structures, but SHIB remains weak at this point.
The RSI indicator did not show an upward divergence and retreated to a point close to neutral levels. The current chart indicates that the March lows may be retested if the $0.00000540-0.00000550 zone cannot be maintained. However, rather than being considered as a harbinger of a sudden and deep collapse, this is explained by the market’s need to rest and re-establish a base.
There does not currently appear to be a trigger that will quickly increase the likelihood of an increase for Shiba Inu. The fact that the price is also significantly below the long-term 200-day average indicates that the weakness on SHIB has been continuing for a long time.