Hyperliquid (HYPE) is at a decisive inflection point after a sharp rejection from the $50 supply zone, and the next move could be extreme on either side. The token has already slipped nearly 5%, signaling early weakness, yet derivatives data still shows a long-heavy market, raising the risk of a squeeze in either direction. At the same time, liquidation clusters are building both above and below current price, setting up a high-volatility breakout scenario.
With structure tightening, HYPE now faces a critical question: Can bulls reclaim momentum and drive a move toward $60, or is a deeper breakdown toward $20 starting to take shape? Read the HYPE price outlook below for more clarity.
Derivatives Positioning: Crowded Longs Raise Risk
Derivatives data shows a long/short ratio of 1.60, with approximately 36,673 long traders vs 22,786 short traders. This indicates a clear bullish bias in positioning. However, such imbalances often create instability. When longs dominate, the market becomes vulnerable to liquidation cascades, especially if price fails to move higher.
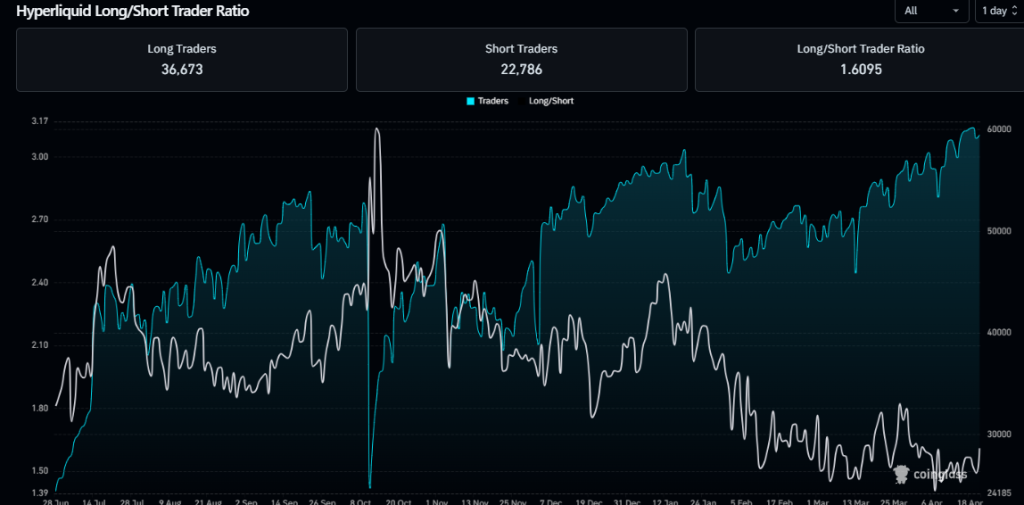
Funding sentiment and positioning suggest that traders are already betting on continuation, which reduces upside surprise and increases the probability of a contrarian move or shakeout before any sustained rally.
Hyperliquid Price Analysis: What’s Next for HYPE?
HYPE’s recent price action shows a clear ascending structure, where higher lows continue to form despite repeated rejections from the $48–$50 supply zone. This indicates that buyers are still active, but lack the strength to break overhead resistance, a classic compression setup.
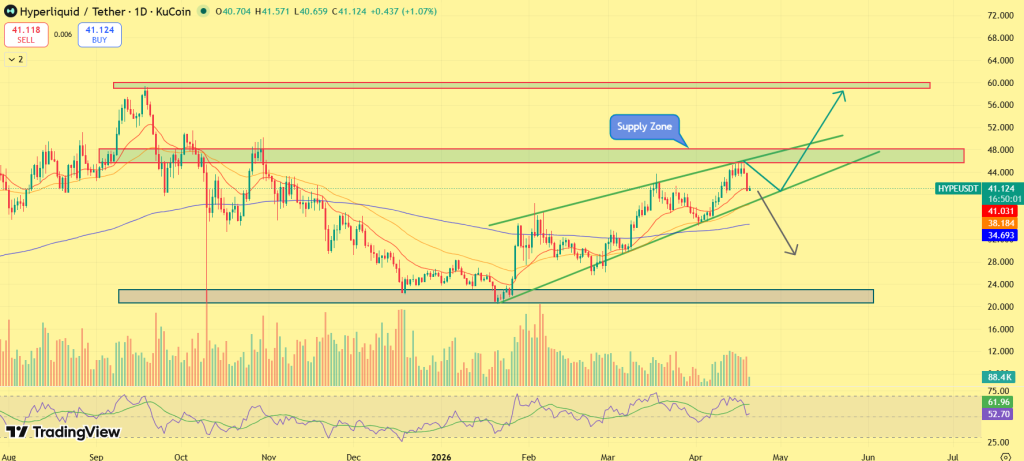

HYPE price is currently trading around the $40–$41 region, sitting right above a rising trendline support. This trendline has acted as a dynamic accumulation zone over the past few weeks, with buyers consistently stepping in on dips. However, the token price remains above the short-term EMAs (20/50), which are now flattening, signaling a transition from impulsive rally to consolidation. However, the 200 EMA still lies above near $48–$50, reinforcing the strength of the supply zone.
If bulls manage to reclaim this zone with volume confirmation, the structure opens up a clean breakout path toward $55–$60, aligning with previous distribution levels. On the downside, a breakdown below the ascending trendline and loss of $38–$35 support would invalidate the bullish structure, exposing a deeper retracement toward the $28–$20 demand zone, where previous accumulation occurred.
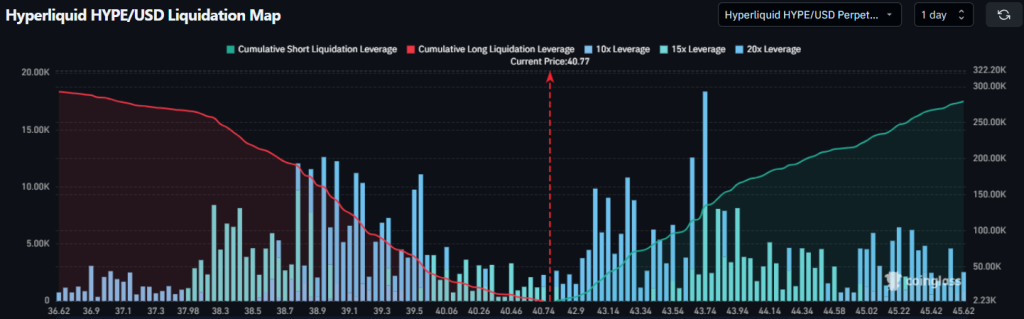
Liquidation Map: Volatility Trigger Zones Identified
Liquidation data provides a clearer view of where the next move could accelerate. On the downside, a significant cluster of leveraged positions is stacked below $38–$35, meaning a breakdown into this zone could trigger forced liquidations, accelerating selling pressure. This aligns with the structural breakdown level on the chart.


On the upside, liquidity is concentrated above $45 and extending toward $50, where short positions and trapped sellers may get liquidated if price breaks out. This creates a liquidity magnet effect, pulling price toward that zone in case of strength. Notably, the liquidation map shows a balanced distribution on both sides, confirming that the market is in a neutral but fragile state, typically seen before large directional moves.
This setup increases the probability of a liquidity sweep first, followed by the actual trend move, meaning traders should expect volatility spikes before confirmation.
Final Take: Market Nears a Decisive Move
HYPE is approaching a critical phase where the current consolidation is unlikely to sustain for long. The combination of tightening price structure, long-heavy positioning, and visible liquidity clusters suggests that a directional move is building.
A sustained push above the $48–$50 supply zone would confirm strength and open the path toward $55–$60, backed by momentum and short covering. On the other hand, a breakdown below $38–$35 support would weaken the structure and increase the probability of a deeper move toward $28–$20 demand levels. The next confirmed move will likely set the tone, not just for the short term, but for HYPE’s broader trend ahead.
Trust with CoinPedia:
CoinPedia has been delivering accurate and timely cryptocurrency and blockchain updates since 2017. All content is created by our expert panel of analysts and journalists, following strict Editorial Guidelines based on E-E-A-T (Experience, Expertise, Authoritativeness, Trustworthiness). Every article is fact-checked against reputable sources to ensure accuracy, transparency, and reliability. Our review policy guarantees unbiased evaluations when recommending exchanges, platforms, or tools. We strive to provide timely updates about everything crypto & blockchain, right from startups to industry majors.
Investment Disclaimer:
All opinions and insights shared represent the author’s own views on current market conditions. Please do your own research before making investment decisions. Neither the writer nor the publication assumes responsibility for your financial choices.
Sponsored and Advertisements:
Sponsored content and affiliate links may appear on our site. Advertisements are marked clearly, and our editorial content remains entirely independent from our ad partners.