Easing geopolitical tensions have strengthened bullish momentum, pushing Bitcoin price to test $76,000 for the first time in two months. At the same time, the Fear & Greed Index has climbed to a six-month high, signaling a shift in sentiment from fear toward neutral. As a result, BTC is now approaching a critical turning point, pressing into a key resistance zone.
Meanwhile, bearish positioning continues to build, with traders increasingly betting on downside even as prices hold firm. This divergence creates a high-stakes setup: a breakout that could invalidate the multi-month bearish structure or a rejection that reinforces it.
Bitcoin Price Analysis in the Short Time Frame
The Bitcoin price is currently attempting to reclaim a critical range between $74K and $78K, a zone that previously acted as support before the breakdown earlier this year. This area now serves as a strong resistance, making the current move a decisive test for the broader trend. Despite the recent recovery, Bitcoin remains below key structural levels, with the 100-day moving average acting as dynamic resistance. A confirmed breakout above this region could signal a shift in market structure, while failure to reclaim it may reinforce the ongoing bearish trend.
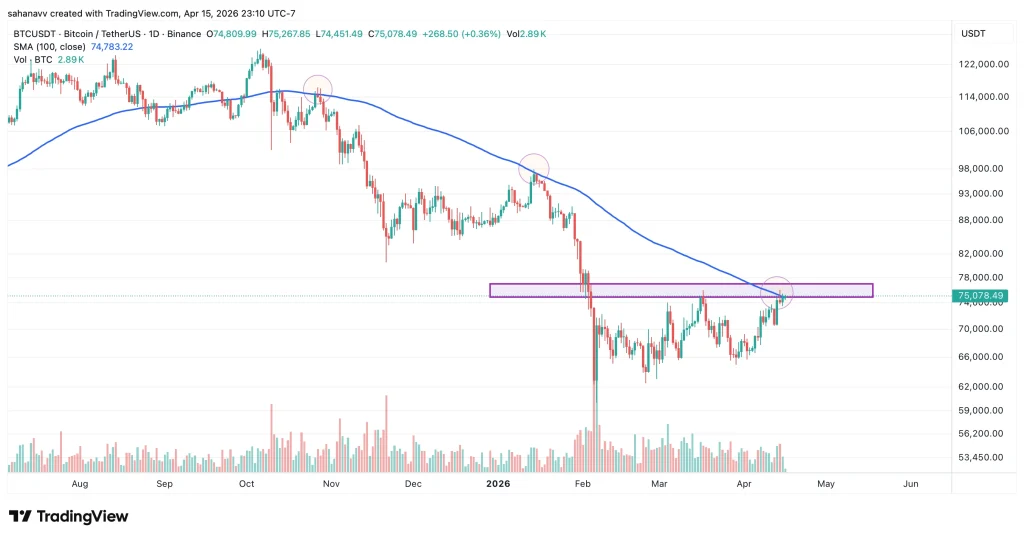
From a technical perspective, Bitcoin’s price action suggests a retest of a breakdown zone rather than a confirmed reversal. The price has been testing the 100-day MA a couple of times since the October bearish trend. During the previous tests, the RSI had reached the upper threshold or approached the range. Currently, the levels are forming constant higher highs and lows, which point towards a breakout beyond the $78,000 resistance.
Bitcoin Price Analysis in the Long Term
Bitcoin’s momentum indicators are beginning to show signs of recovery, with the weekly RSI bouncing from lower levels and turning upward. This shift suggests that selling pressure is easing and buyers are gradually stepping back in. Historically, similar RSI reversals from sub-40 levels have marked the early stages of trend recovery, but not immediate breakouts. The current move reflects improving momentum, not confirmed bullish control.
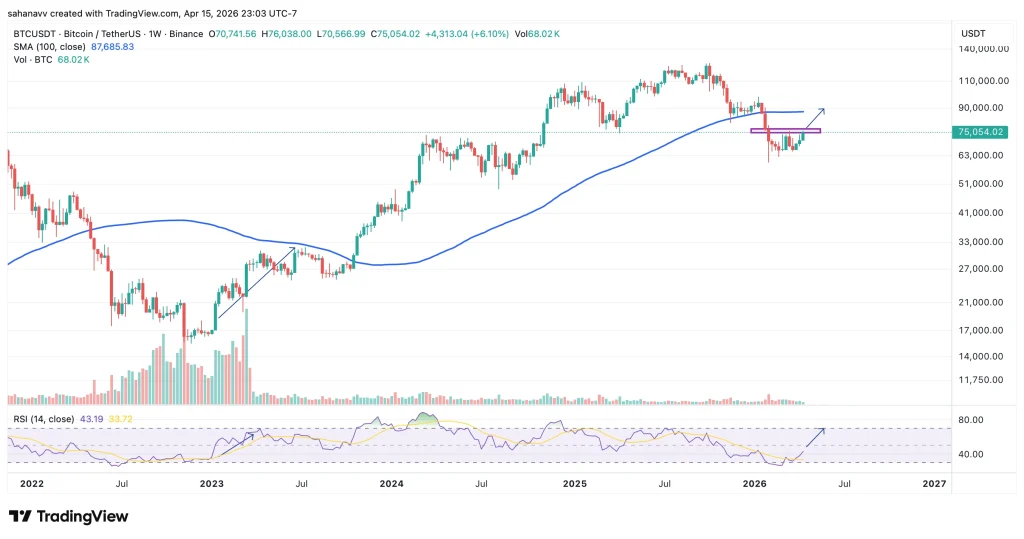

However, the RSI remains below the key bullish threshold near 60, indicating that the market has not fully transitioned into an uptrend. Until momentum strengthens further, this recovery phase should be treated with caution. A continued push higher in RSI alongside a breakout above resistance would strengthen the bullish case, while failure to sustain this momentum could align with another rejection at current levels.
Bitcoin Funding Rates Signal Rising Short-Pressure
Bitcoin funding rates have turned persistently negative, indicating that short traders are increasingly dominating the derivatives market. This shift reflects a growing bearish bias, with traders actively betting on further downside as the price approaches a key resistance zone. Historically, such sustained negative funding suggests that market participants expect rejection rather than a breakout.
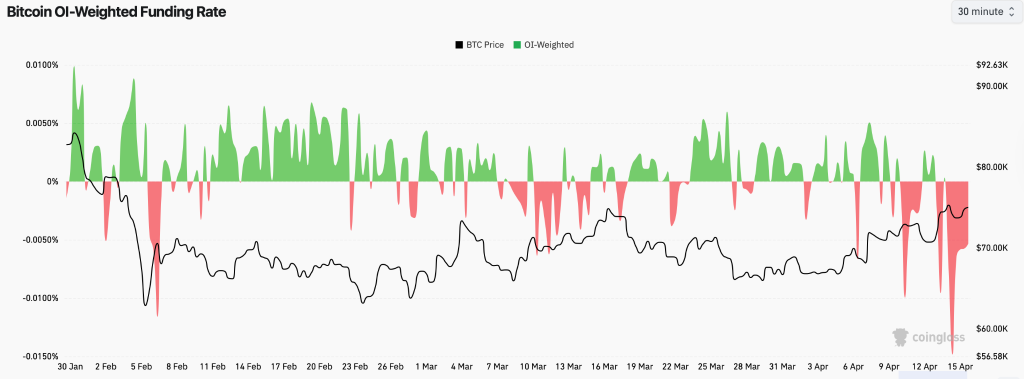

However, the current setup presents a notable divergence. Despite heavy short positioning, Bitcoin’s price has continued to hold its range and gradually push higher. This imbalance between bearish sentiment and stable price action often signals underlying strength, as selling pressure fails to drive the market lower. If this trend persists, it increases the probability of a short squeeze, especially if Bitcoin manages to break above resistance levels.
What’s Next for BTC Price: $78,000 Break or a Sharp Rejection?
The Bitcoin price is sitting at a high-conviction decision zone, where structure, momentum, and positioning are all converging. Price is testing the $74K–$78K resistance band while funding remains negative, signaling crowded shorts. For traders, the key trigger is clear: a confirmed reclaim above $78K and acceptance above the 100-day MA could unlock a squeeze toward $82K, followed by $88K and potentially $95K. This is where bearish positioning becomes fuel for upside, not confirmation of downside.
On the flip side, failure to break and hold this zone keeps the broader bearish structure intact. A rejection here, especially with a loss of $72K support, would validate short positioning and likely drive price back toward $68K and $64K. Until a breakout is confirmed, the scenario remains a bearish retest with bullish pressure building, making a reaction at current levels the defining signal for the next directional move.
Trust with CoinPedia:
CoinPedia has been delivering accurate and timely cryptocurrency and blockchain updates since 2017. All content is created by our expert panel of analysts and journalists, following strict Editorial Guidelines based on E-E-A-T (Experience, Expertise, Authoritativeness, Trustworthiness). Every article is fact-checked against reputable sources to ensure accuracy, transparency, and reliability. Our review policy guarantees unbiased evaluations when recommending exchanges, platforms, or tools. We strive to provide timely updates about everything crypto & blockchain, right from startups to industry majors.
Investment Disclaimer:
All opinions and insights shared represent the author’s own views on current market conditions. Please do your own research before making investment decisions. Neither the writer nor the publication assumes responsibility for your financial choices.
Sponsored and Advertisements:
Sponsored content and affiliate links may appear on our site. Advertisements are marked clearly, and our editorial content remains entirely independent from our ad partners.