


The recent price action has compelled market participants to think about whether the Bitcoin price is still going deeper. No sooner than the token faced rejection in an attempt to sustain itself above $72,000, the selling volume intensified. Despite this, the price has managed to trade within a key support zone. Therefore, is it fair enough to say that the bears are preparing for another bearish trap? Will the BTC price plunge below $65,000 or is a strong rebound fast approaching?
To analyse the next price action, we need to first have a look at short-time frame indicators.
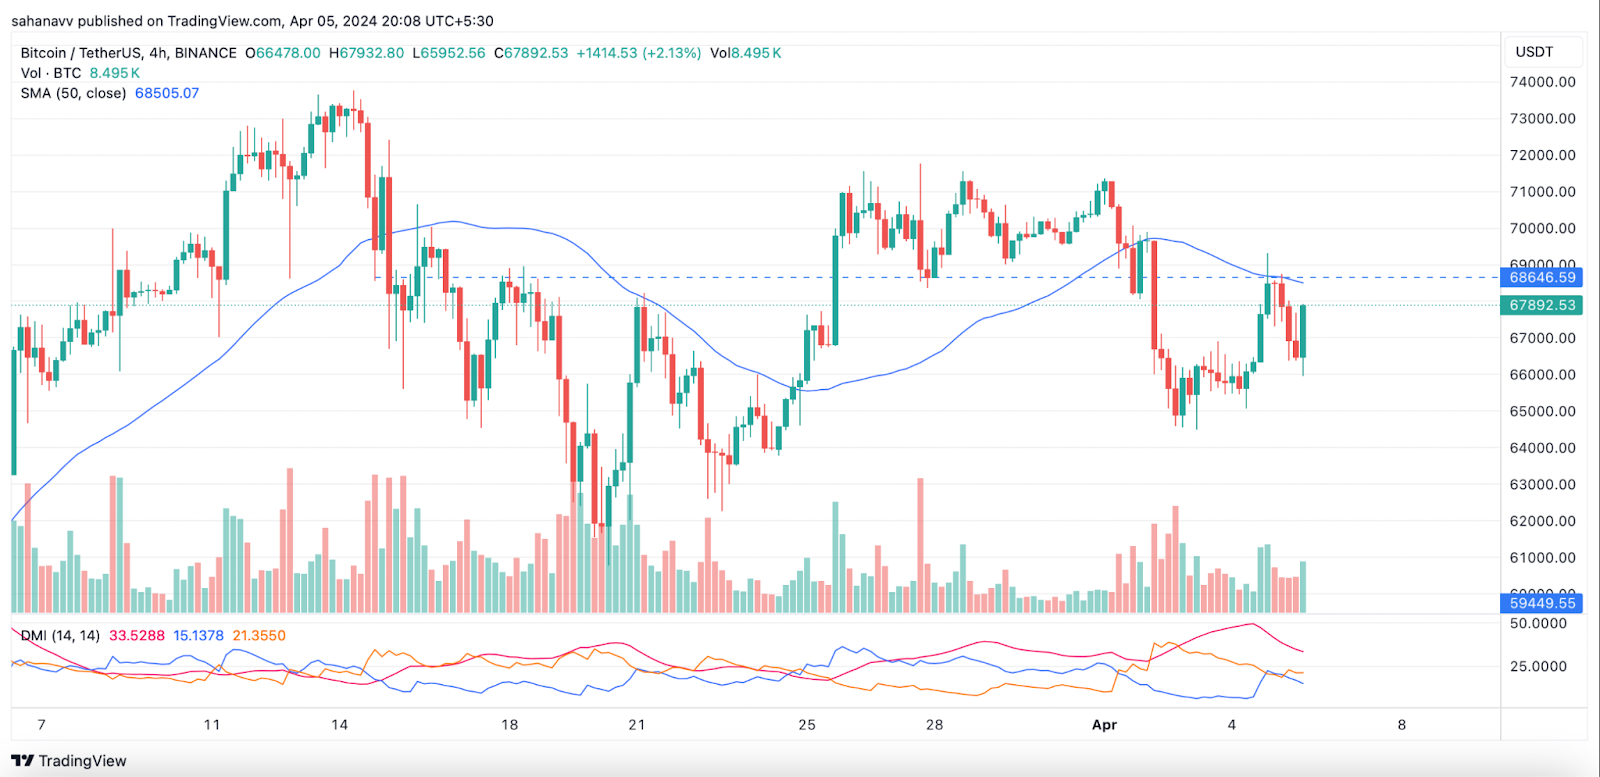
The 4-hr chart displays a rejection at the logical resistance which is nothing but the simple Moving Average of 50 days, with the candles closing below these levels, despite multiple attempts to pull up above the levels. Therefore, this suggests the BTC price in the short term continues to be in a correction mode. However, the hourly time frame displays a little diverse trend.
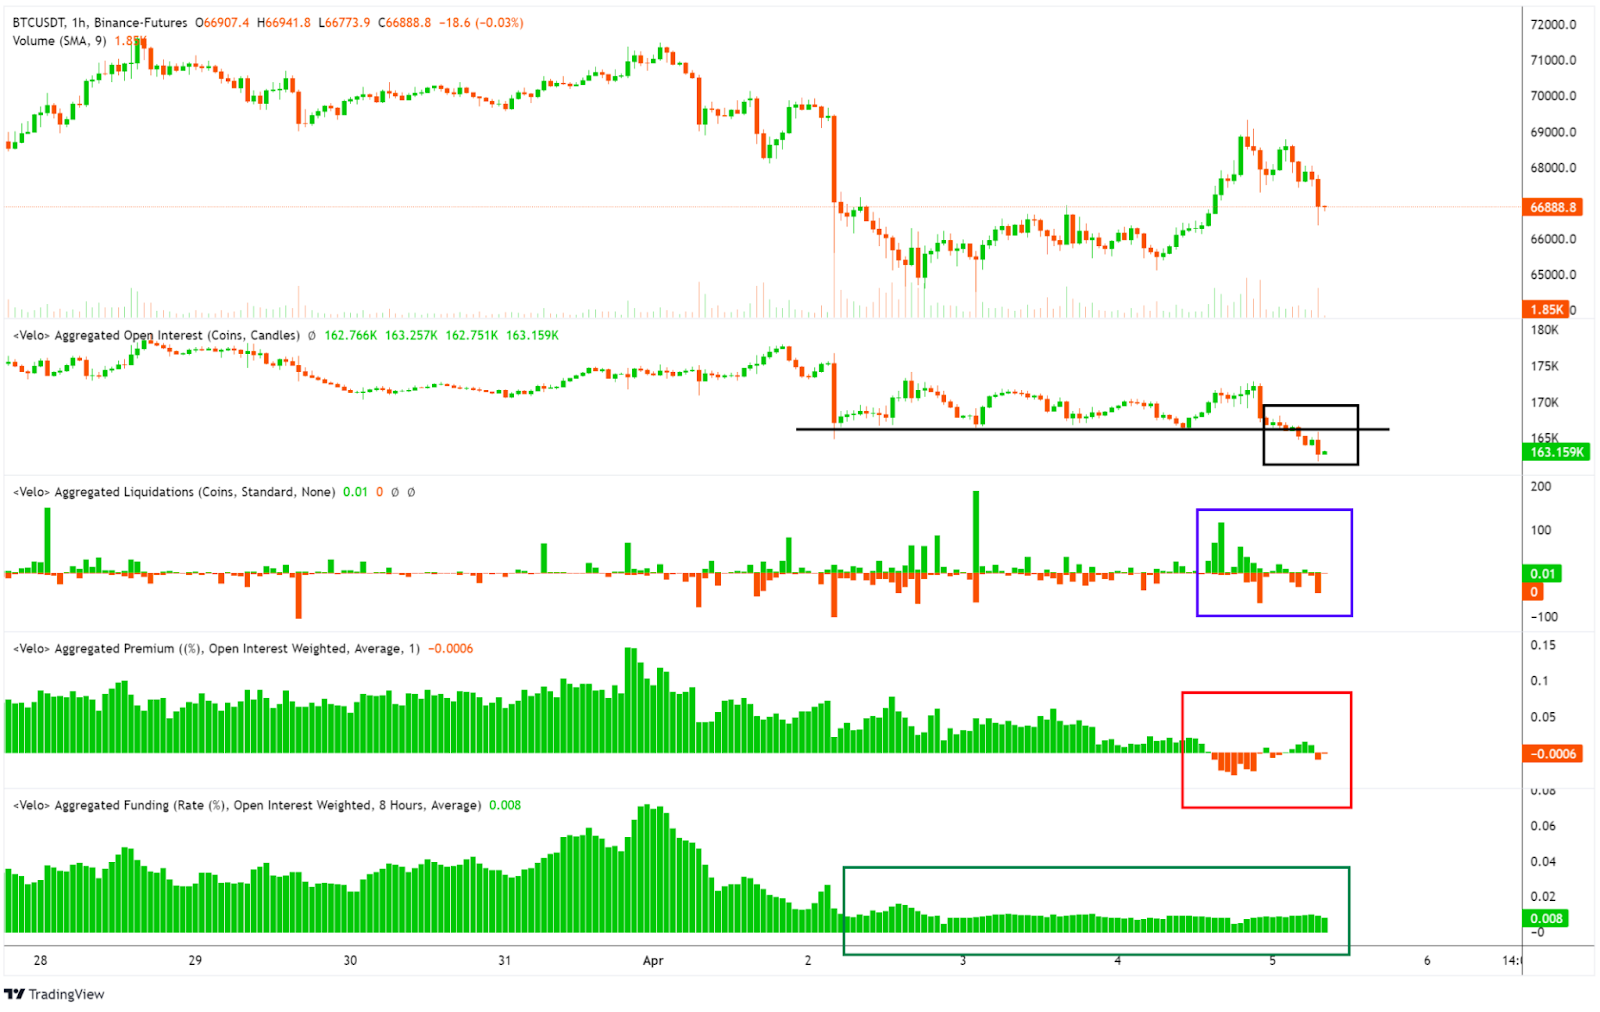
The future contract in the hourly chart indicates the Open Interest (OI) has plunged below the key support line. Although some short liquidations were encountered, the premium is still negative, and funding rates continue to be low. Therefore, future markets appear to be pretty clean, which is necessary for an uptrend. Besides, the liquidation heat maps suggest potential upper and lower targets.
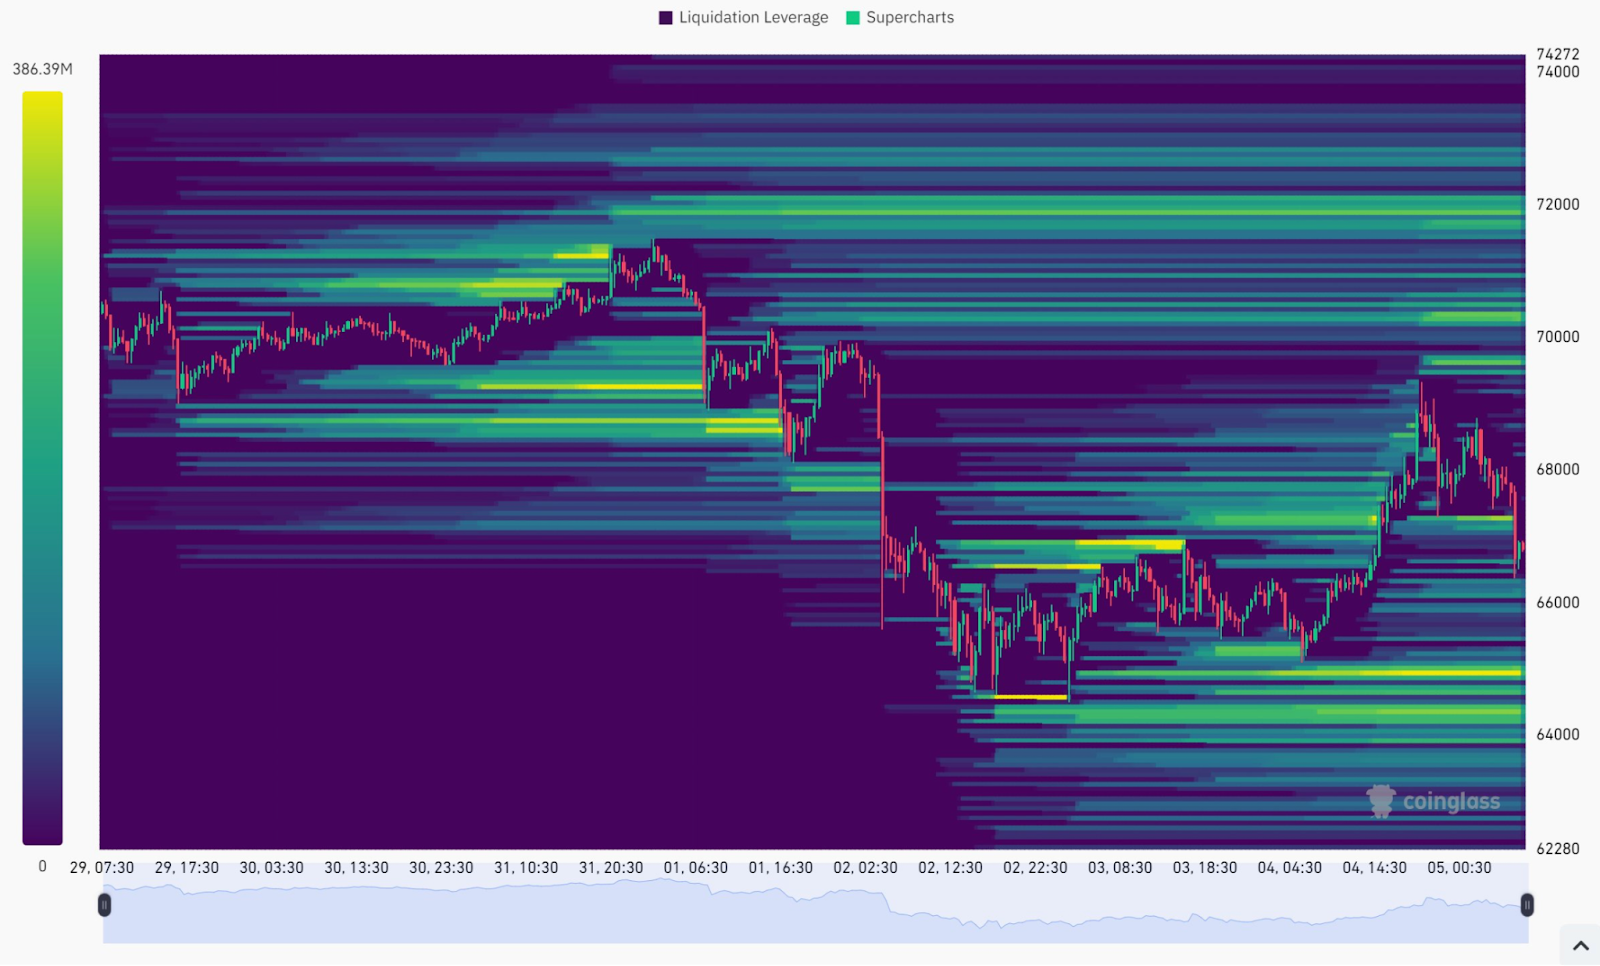
The liquidation heatmap suggests new long liquidation levels have appeared on the chart below $65,000. Besides, the region above $69,300 also appears to be dense, and hence a breakout above $72,000 is likely to lead to a massive short squeeze. Therefore, if the levels around $66,000 are broken, then a liquidity flush towards $64,000 and $65,000 may be possible.
Alongside, the ETFs have been less active this week, as ARK had some outflow on Wednesday and Grayscale was selling less than last week. The current break in institutional buying fits the current correction. A pause was expected and the renewed interest will end this correction. Moreover, the technicals in the short term are bearish with a pending MACD bearish cross plus a bearish signal line crossing of RSI. This suggests a pullback towards a retest of the previous trading range between $65,000 and $66,000.
Therefore, the levels around $65,000 appear to be pretty important and if they break, we can expect a short flush to the $62,000 and $63,000 ranges.
