


With the emergence of new tokens, the major tokens are experiencing liquidity drain to some extent. This has hindered the rally’s progress as Bitcoin has been trading within a narrow region. The below-mentioned technical indicators suggest the BTC price is at the foothills of a massive explosion.
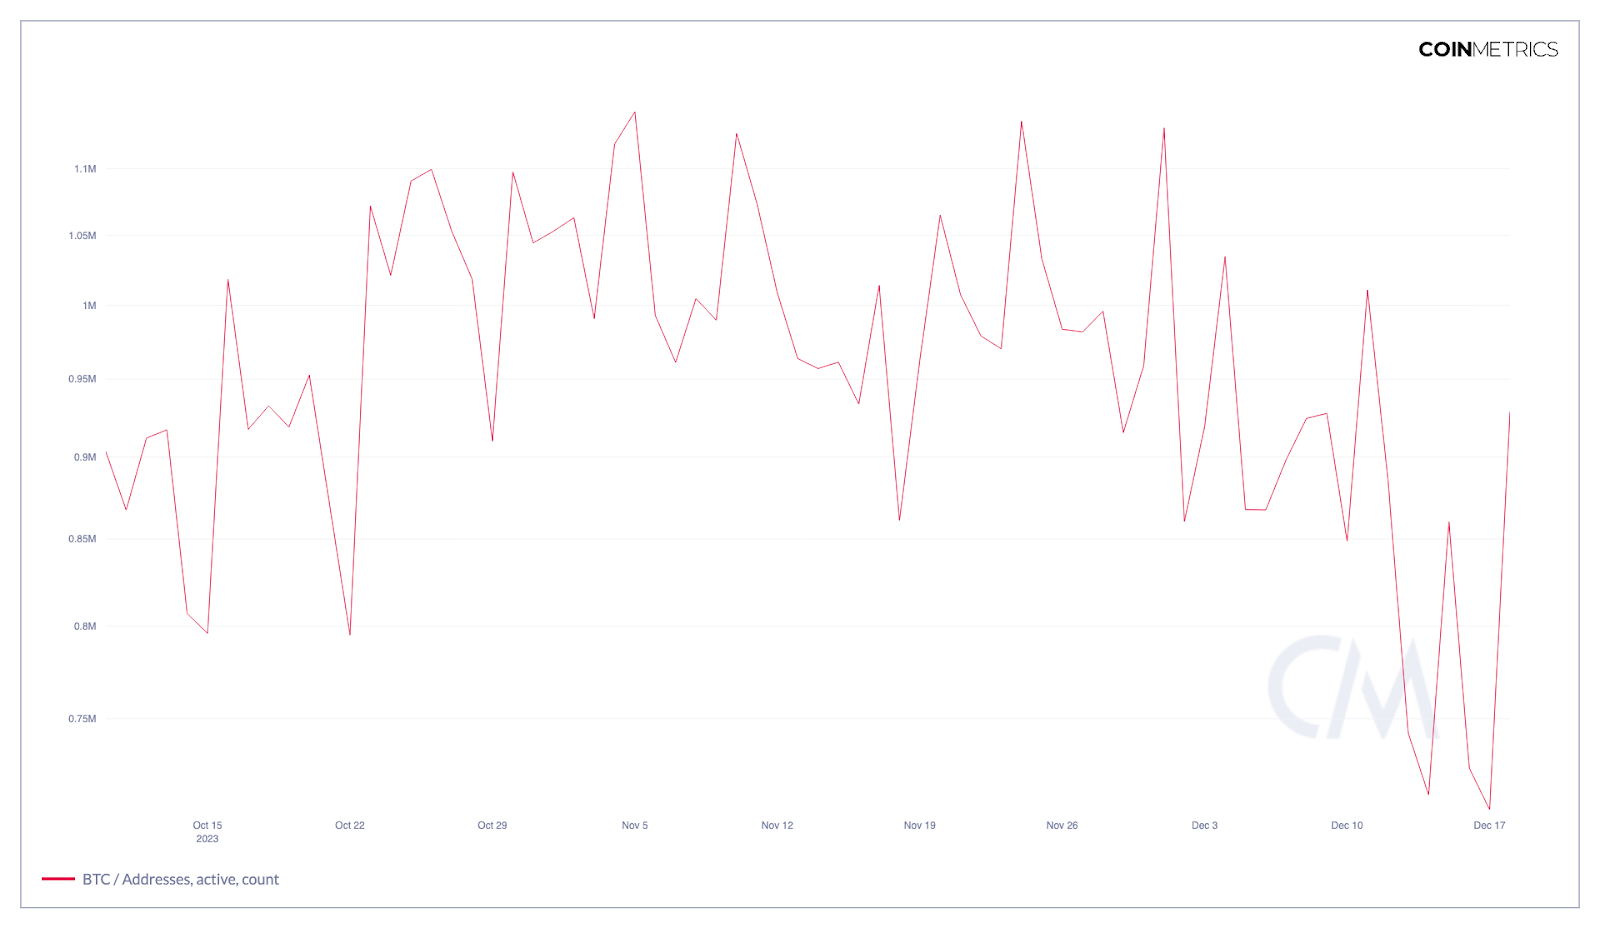
Rising Active Address Count
The active address count is the number of addresses interacting with the platform to perform a trade. All the addresses, regardless of whether they are a buy, a sell, or a swap trade, are considered only once. The address count had dropped heavily at the beginning of the month and marked a low a few days ago. Besides, the levels have rebounded finely from 700K to levels beyond 900K in just 24 hours, indicating a rise in trading activity over the platform.
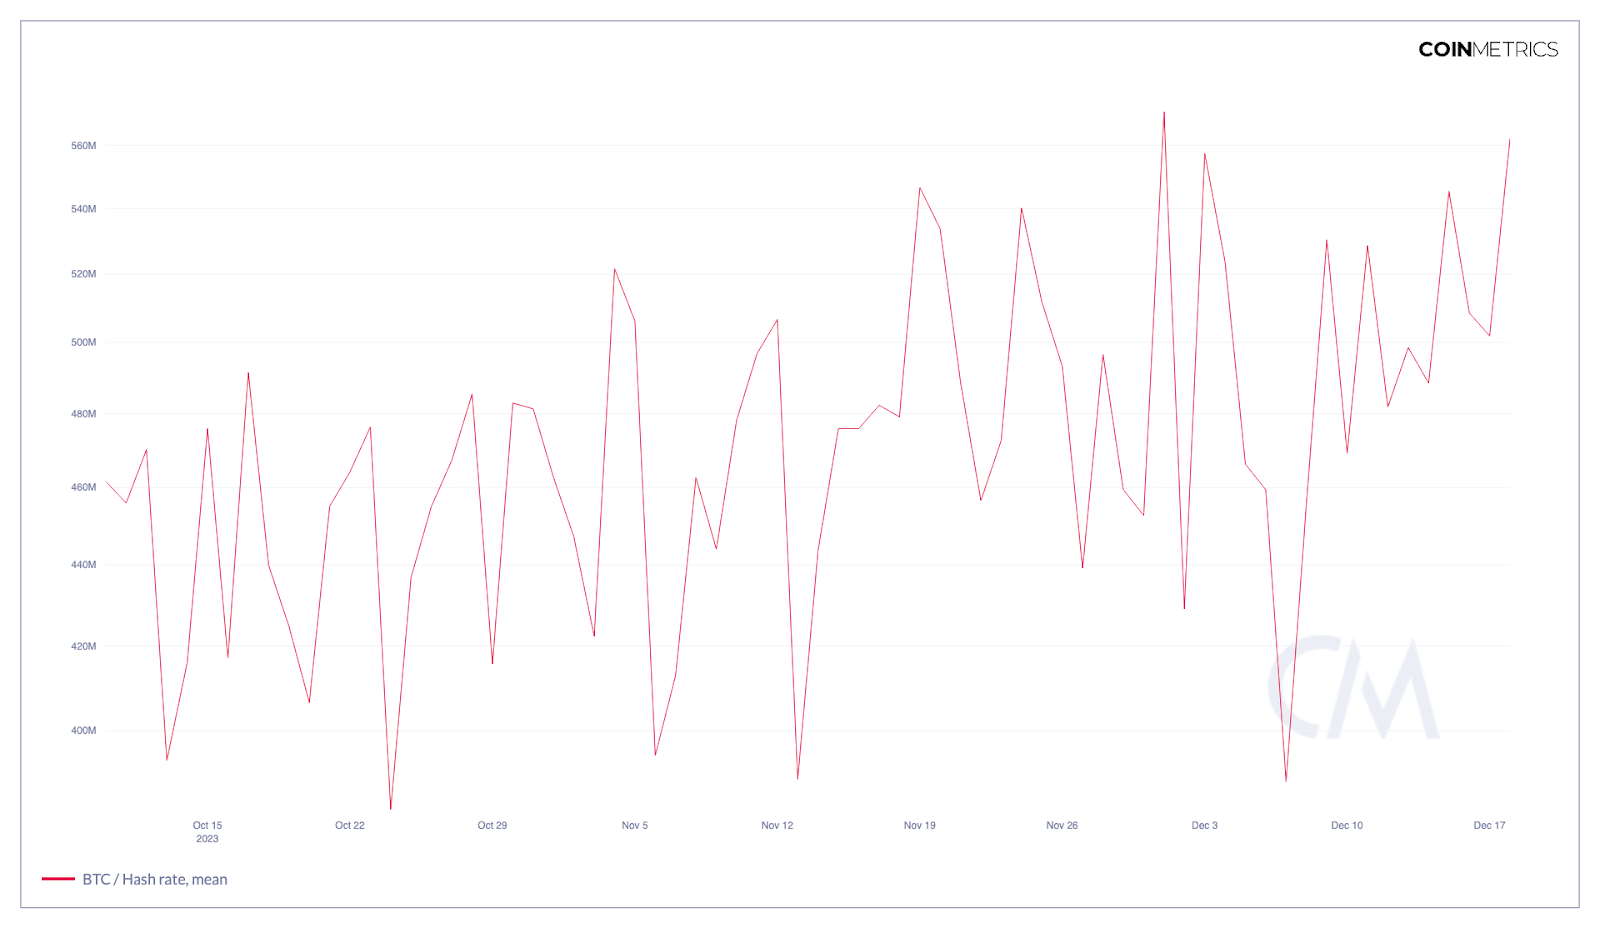
Bitcoin Hash Rate Surging
The mean hash rate suggests the computational power required for the miners to validate a transaction and add the block to the chain. The rise and the drop in the hash rate suggest that the participation of the miners rises with more participants and drops as they decrease. The hash rate had reached a high of above 570.915M TH/s a few days ago and dropped later to below $390M TH/s. Currently, the levels are surging back to the highs, indicating a rise in mining activity, making the platform more decentralised.
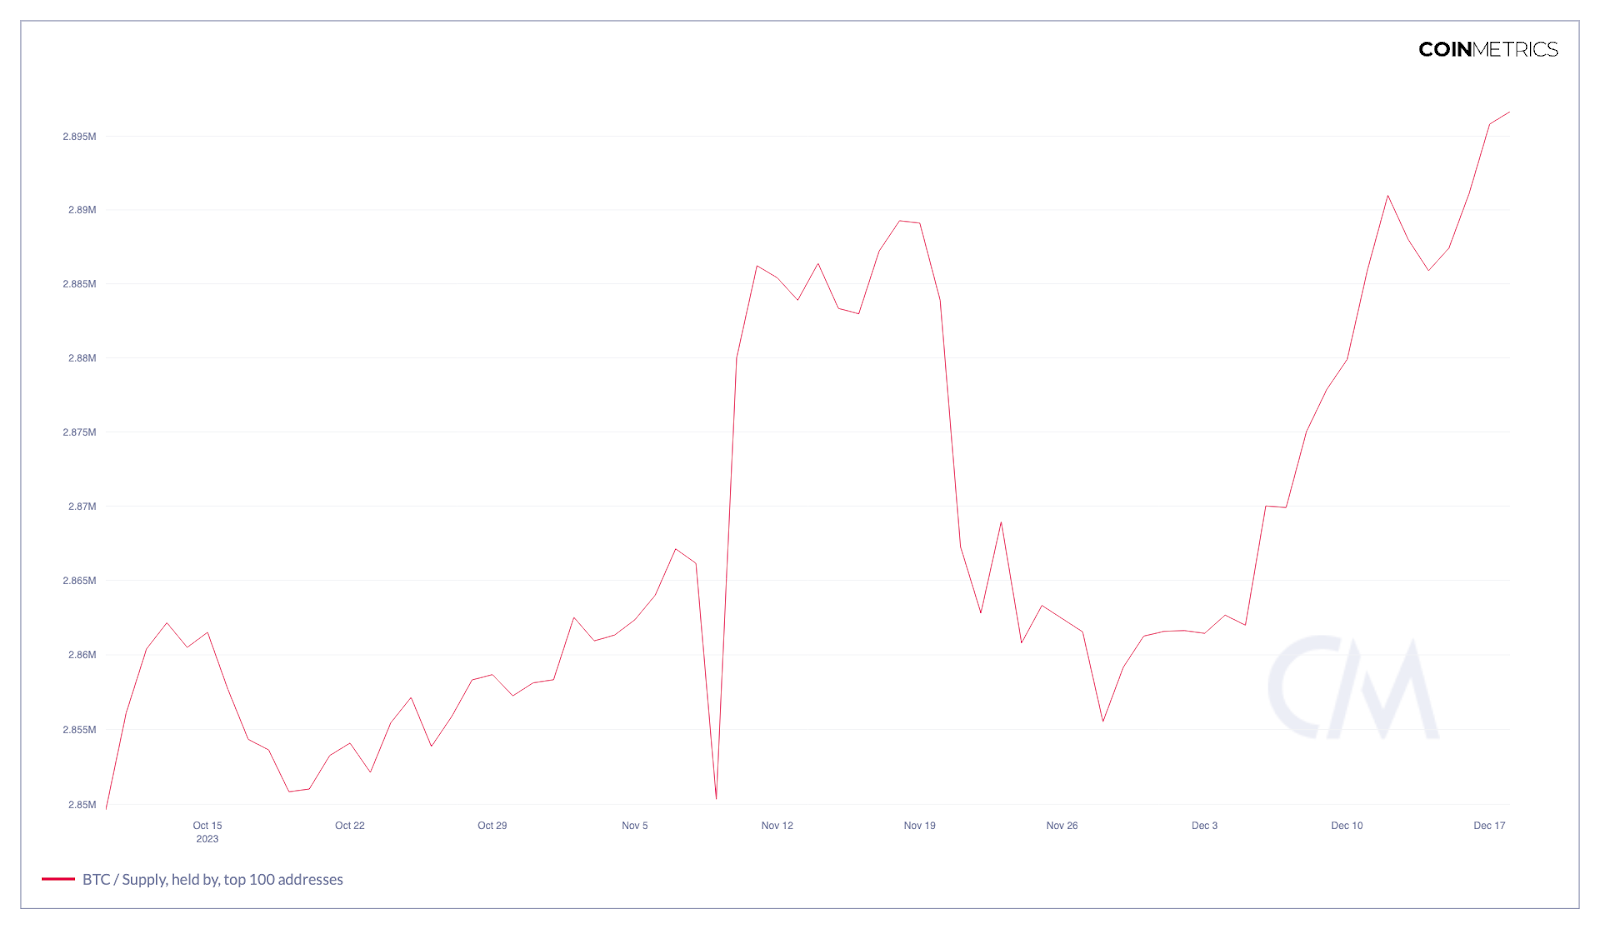
Whales Continue to Accumulate Bitcoin
The top 100 Bitcoin addresses are considered to be held by whales, as they contain thousands of millions of BTC. The drop in the top 100 wallets suggests the whales have been constantly liquidating their tokens, which may be bearish for Bitcoin. However, the levels rebounded at the beginning of the month and have reached the levels last seen in December 2022. The rise in whale accumulation is a bullish indicator that may further cause a huge shift in market sentiments.
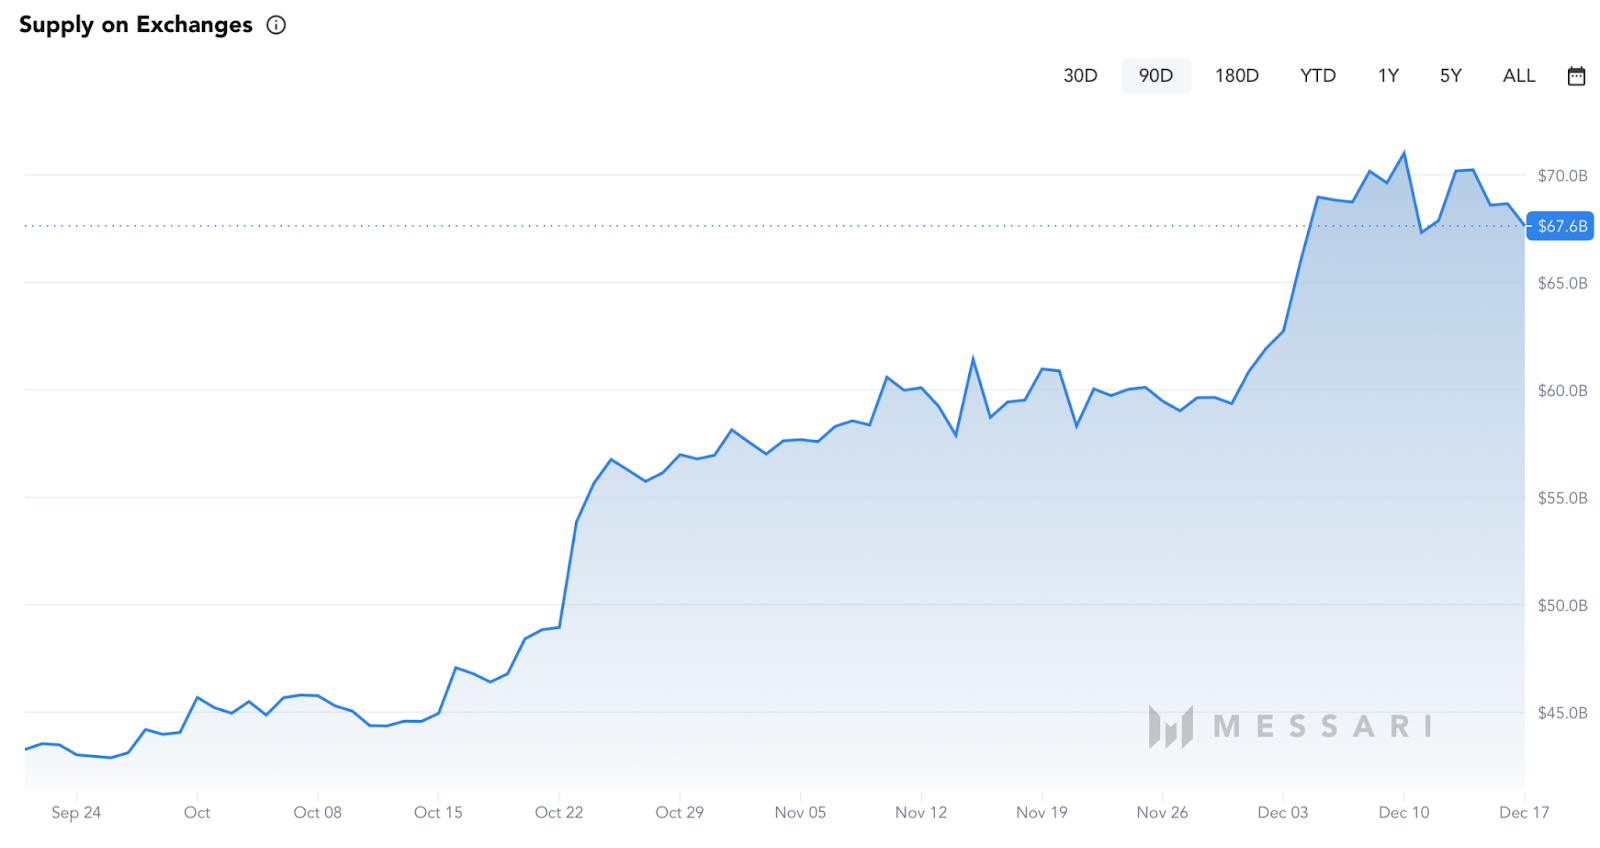
Significant Drop in Supply on Exchanges
The supply on the exchanges indicates the sentiments of the investors. Whenever the investors wish to perform a trade, they usually transfer their tokens back to the exchanges. This is when the balance on the exchange is a bearish signal for the token. However, the supply on the exchange is dropping, which indicates investors are bullish, and hence they have moved them out of the exchanges and stored them in their wallets.
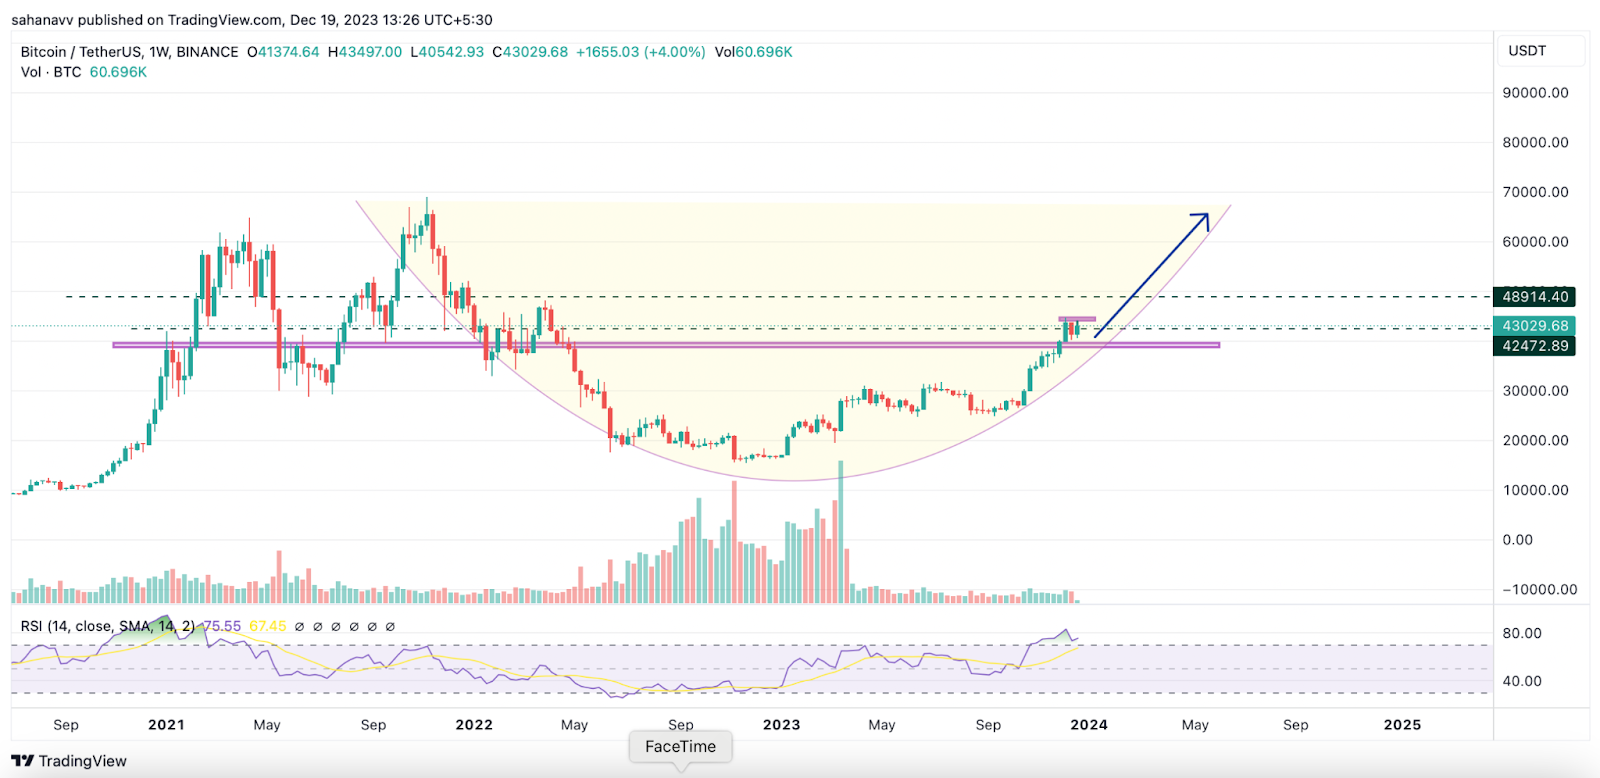
Bitcoin (BTC) Price Analysis
The Bitcoin price in the long term is trading within a parabolic curve, and after hovering within the pre-determined range for a while, a bullish breakout is imminent. The bullish volume has risen notably in the past few weeks, which indicates the price may maintain a healthy upswing in the coming days. Therefore, the price may continue to hold the lower support trend line and reach the neckline at the previous highs of $69,000 in the next few months. Further, this may validate a bullish pattern after a minor pullback from the neckline.
The above indicators suggest the Star Crypto is close to triggering a bullish upswing, which may lead the Bitcoin (BTC) price towards new highs.
