


The market participants have turned optimistic about the crypto markets nowadays. Interestingly, a small shift of focus is witnessed from the star crypto, Bitcoin, which is more or less stagnant. The minor price variations could have caused the traders to look out for other options, and this could be the reason that some of the altcoins are gaining extreme strength.
Tokens like Injective, Blur, Thorchain, Pancakeswap, Solana, etc., and a few more have recorded more than 90% in the past 30 days. Will these tokens continue to outperform Bitcoin in November, or will the flagship crypto reclaim its lost dominance and market share?
Injective (INJ) Price Analysis
The injective protocol has displayed a remarkable move in the past few weeks and has become the top-performing asset in the top 100. With a jump of over 125%, INJ has reached levels close to $18 for the first time since May 2021. Although the volume appears to be less than the previous, bulls have held a huge dominance, due to which bearish activity has been restricted to a large extent.
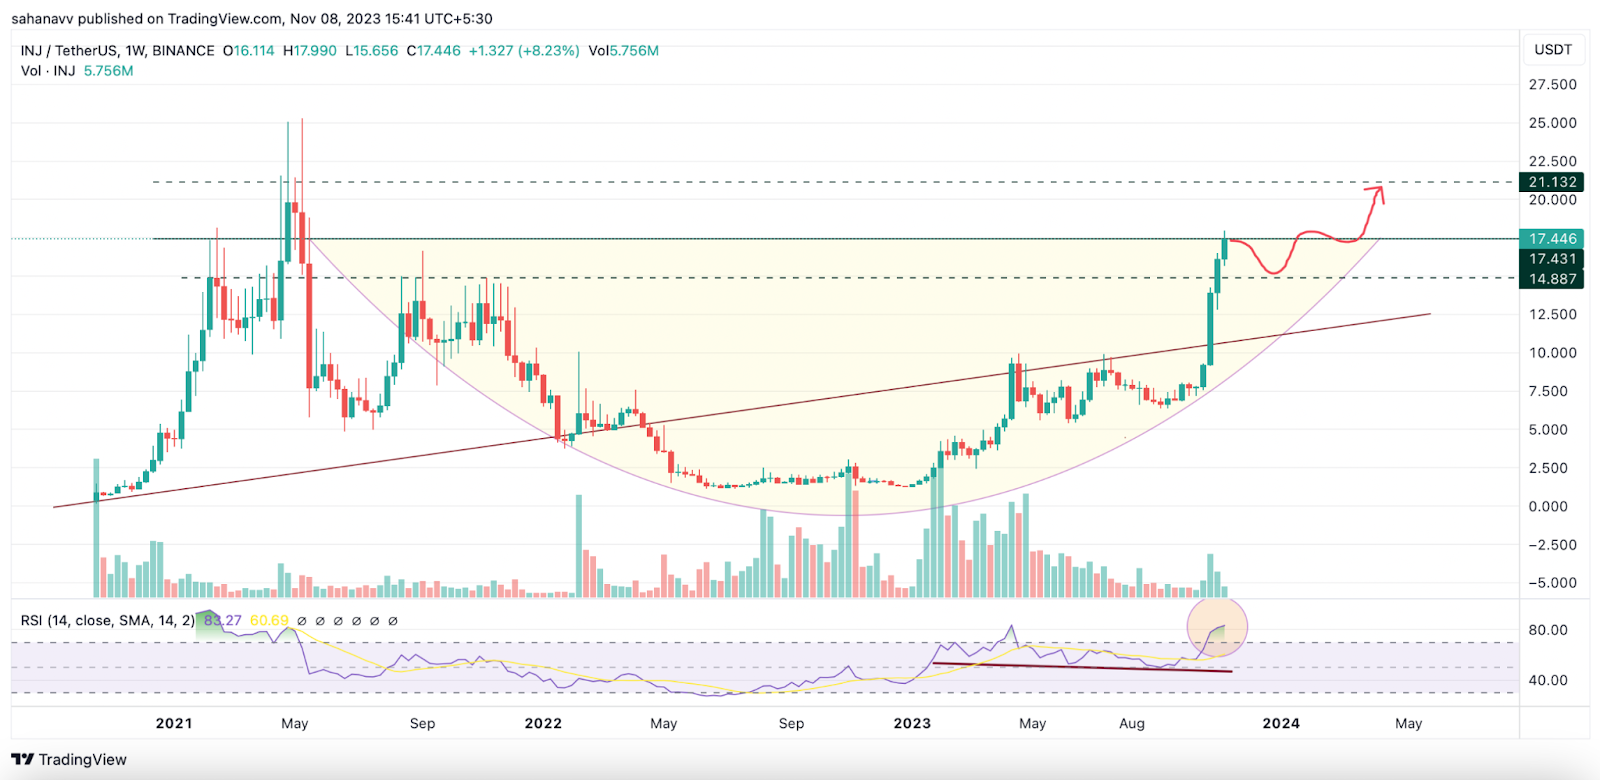
Currently, the price is testing the neckline of the parabolic recovery curve, which coincides with the pivotal resistance. Despite the fact that buying pressure has been elevated, the weekly RSI has displayed a bearish divergence, with a trend slightly ranging towards the south. This could hinder the progress of the rally for a while, dragging the price levels close to $15 or slightly below, followed by a rebound toward $20.
Blur (BLUR) Price Analysis
Since the beginning, the Blur token has been experiencing a drastic fall. Despite massive bearish action, the price sustained above the crucial support level of $0.1. The recent upswing has enabled the token to rise over 160% to reach levels above $0.4. Unfortunately, the price is facing turbulence in rising above these levels as the bears are trying hard to validate a rejection.
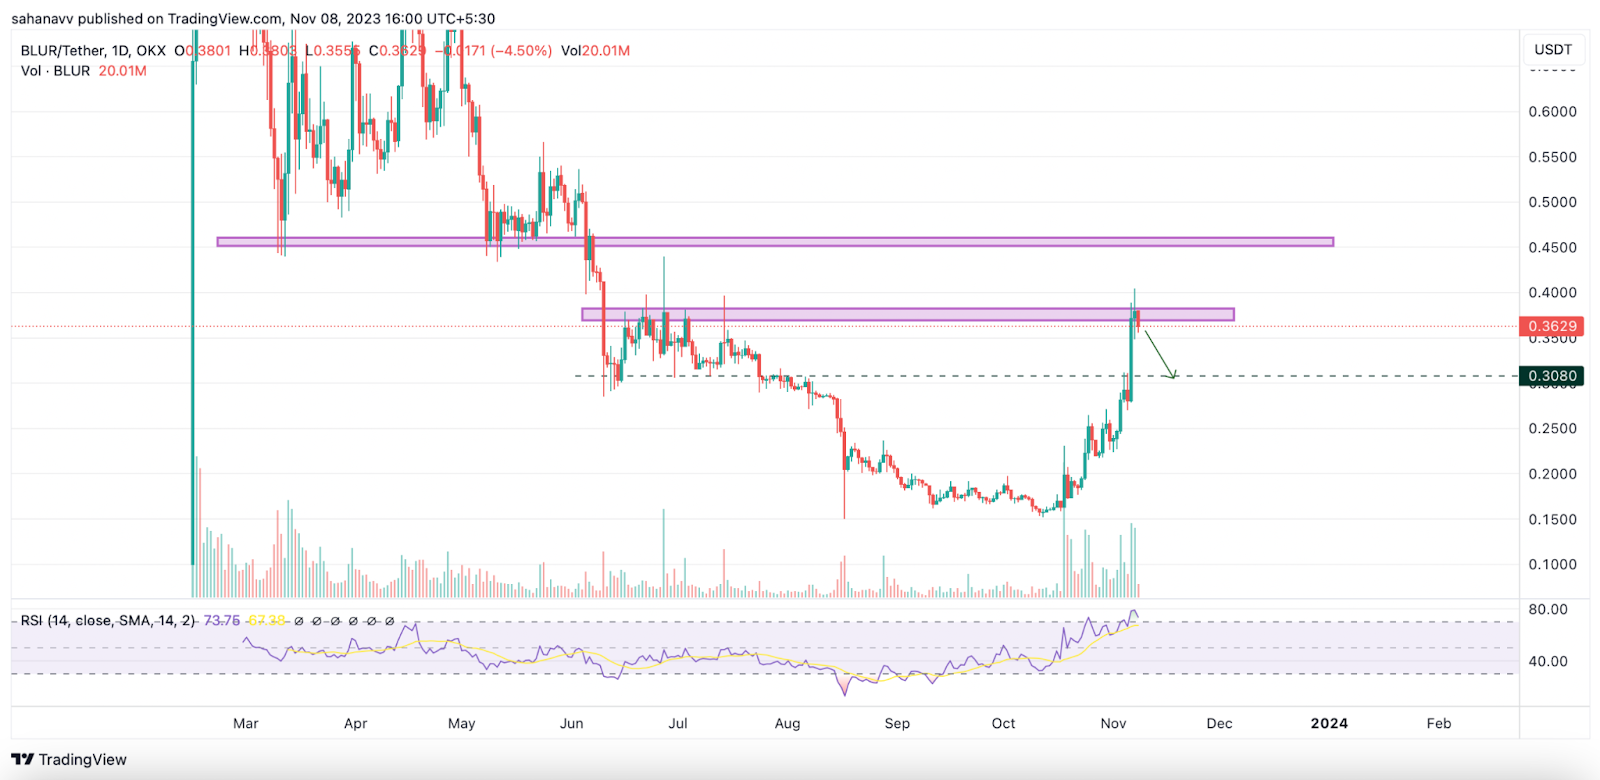
The volume appears to have dropped heavily and is largely dominated by sellers. Besides, the RSI is also displaying the possibility of a bearish divergence, which may begin a notable pullback. Hence, the price is speculated to undergo a notable pullback and test the lower support around $0.3. This can be considered a liquidity zone as the bulls appear to be waiting to enter at these levels.
Solana (SOL) Price Analysis
Solana has been one of the top-performing assets in recent times as the token emerged out of a massive bearish well. The token was considered dead after the FTX scare haunted the rally for quite a while. However, the token bounced back firmly, letting out signals of a significant recovery for the rest of the year.
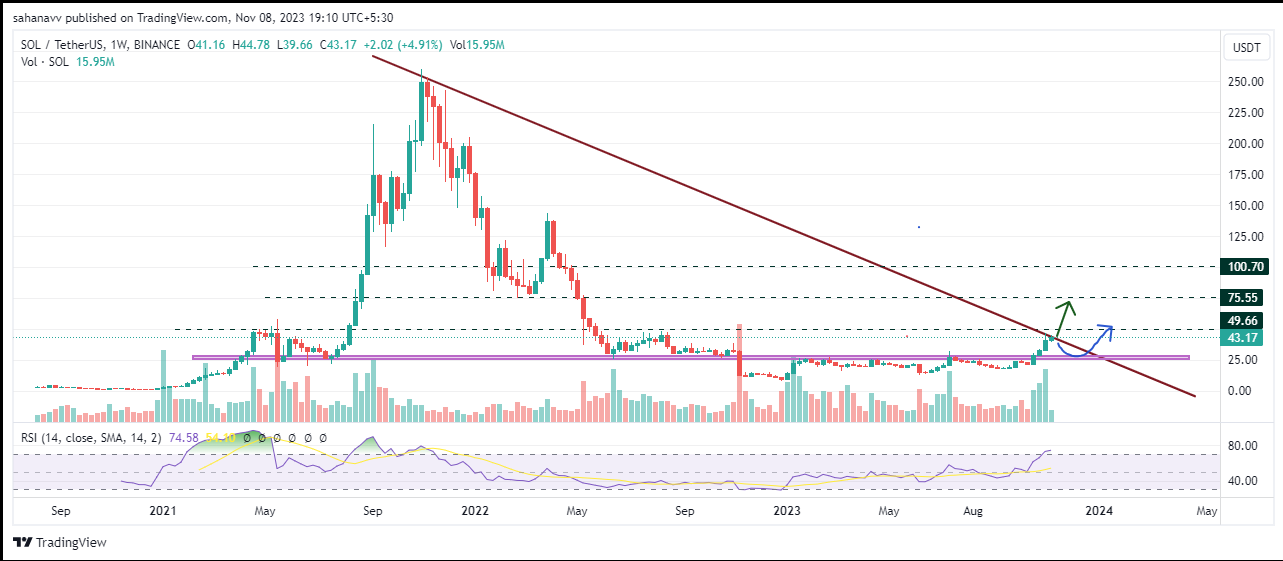
Currently, the SOL price is trading around a decisive phase as it is testing the multi-year descending trend line after rising above the crucial support levels. Therefore, it carries both the possibility of a bullish breakout and a bearish pullback. The weekly RSI suggests a minor pullback could be on the cards, but the volume accumulated is lenient towards the bulls. Hence, the Solana price may either break above the resistance and aim to reach the higher target above $55, or else undergo a minor pullback and attract liquidity to trigger a fresh bullish wave.
