


Bitcoin’s recent market trends suggest a robust stagnation as the price continues to consolidate near $29,500. Traders, known for their quick moves and sharp instincts, seem to be worried, finding Bitcoin’s current behavior less than thrilling. One of the primary reasons for this boring movement is the resistance from long-term Bitcoin holders to liquidate their holdings.
Bitcoin Flashes Historically Low Volatility At $29K
Buyers are currently paying higher prices as there’s a notable shift between Short-Term Holders (STH) and Long-Term Holders (LTH). This year, the wealth of the STH cohort has surged by +$22B, while the LTH group has witnessed a decrease of roughly -$21B.
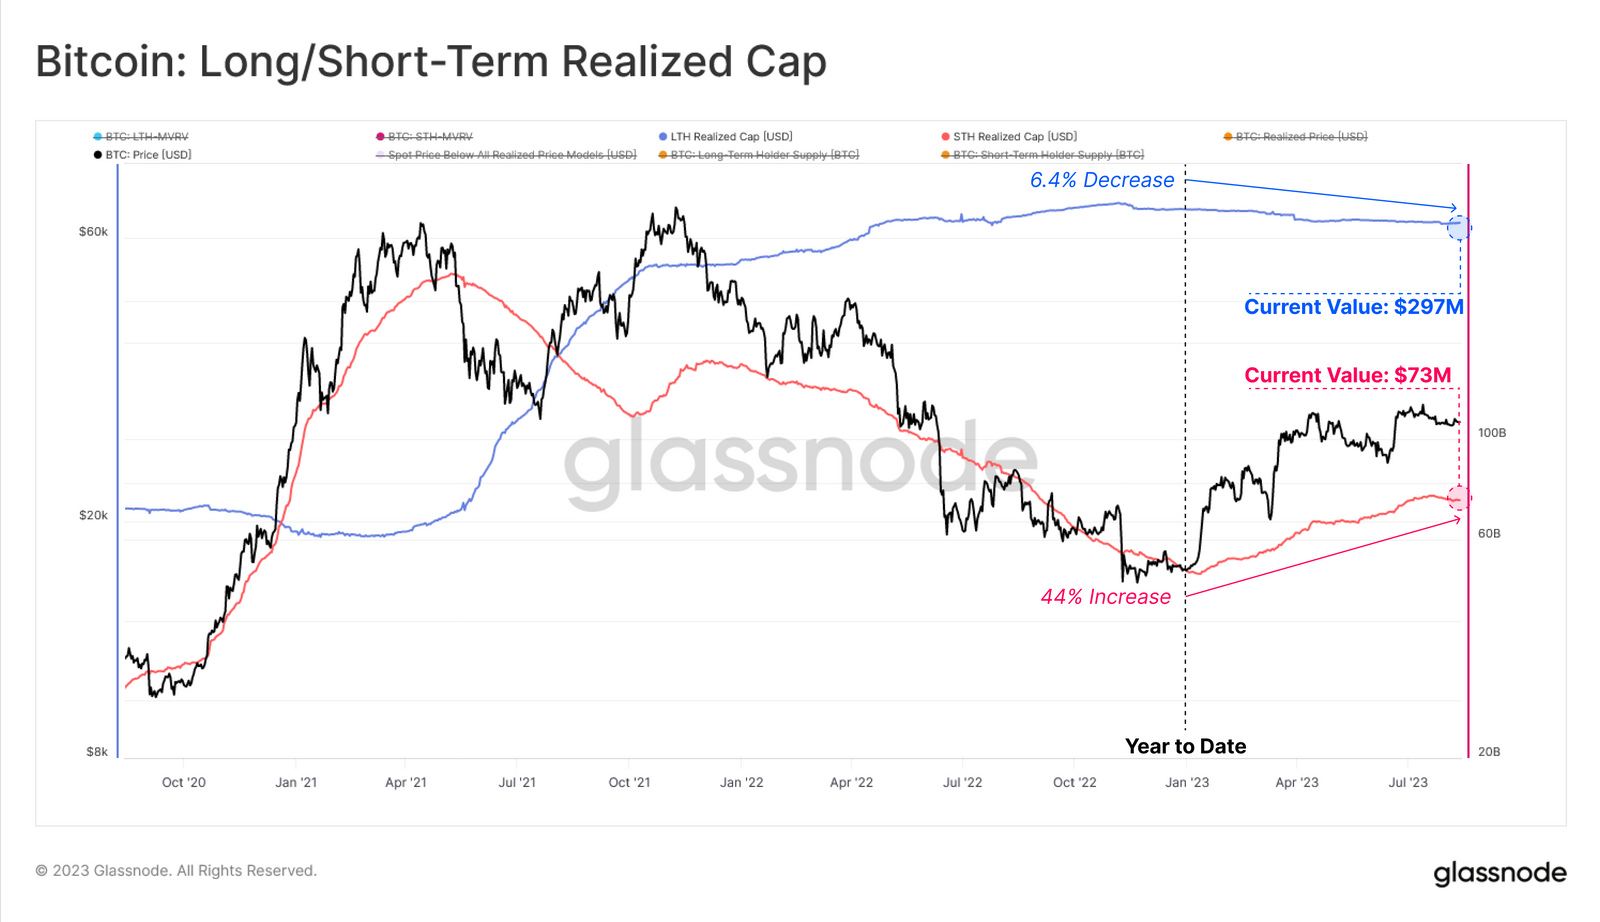
This suggests that STHs have been actively chasing the market, which has led to an elevated average cost basis. Their enthusiasm and active trading have pushed prices higher. The STH’s average cost has surged 59% YTD to $28.6k, while the LTH’s stands lower at $20.3k, showing new Bitcoin investors bought at higher prices, which is a positive sign for the market.
Glassnode reports that the supply retained by Long-Term Holders has reached a record high of 14.6M BTC. On the other hand, the supply from Short-Term Holders has plummeted to a multi-year low at 2.56M BTC.
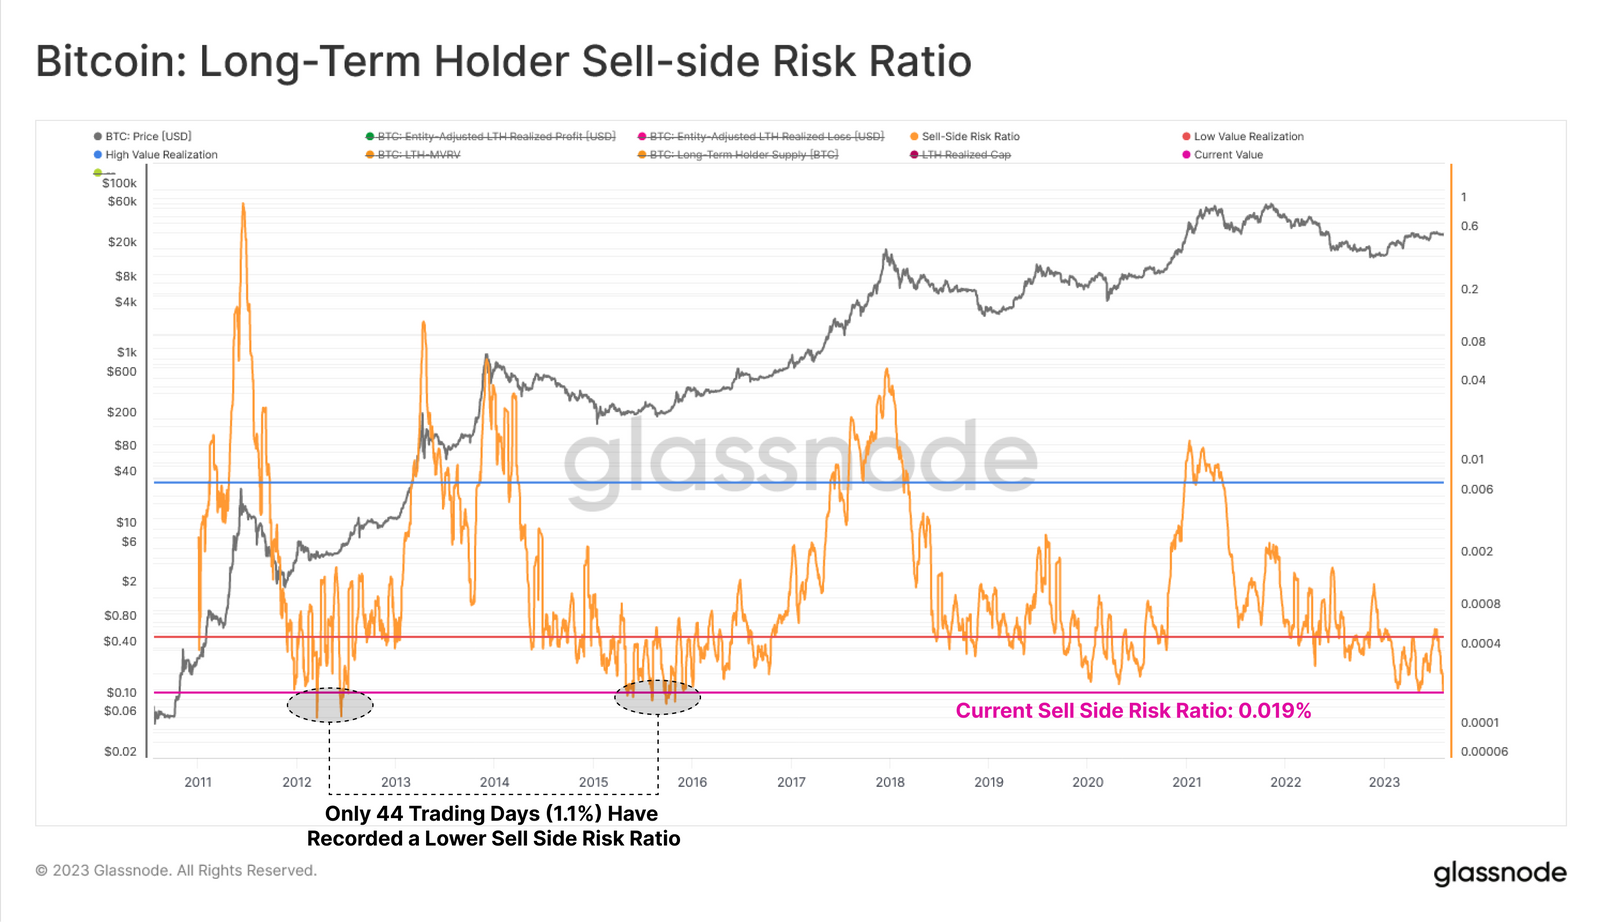
This data underscores the strong confidence Bitcoin investors have, with a minimal number considering liquidation of their assets. The Long-Term Sell-Side Risk Ratio is nearing its lowest levels, with merely 44 trading days (or 1.1%) showing a lesser value. This indicates that a significant price shift, either upward or downward, might be necessary to shake off the current investor indifference and fatigue.
Bitcoin’s volatility is low, with minimal on-chain spending. Low volatility signals weak demand from the market, while a slightly rising Realized Cap indicates a flat market.
What’s Next For Bitcoin Price?
Bitcoin continues to hover around the 100-day EMA trend line at $29.4K on the 4-hour price chart, indicating a tug of war between buyers and sellers. As of writing, BTC price trades at $29,418, surging over 0.52% in the last 24 hours.
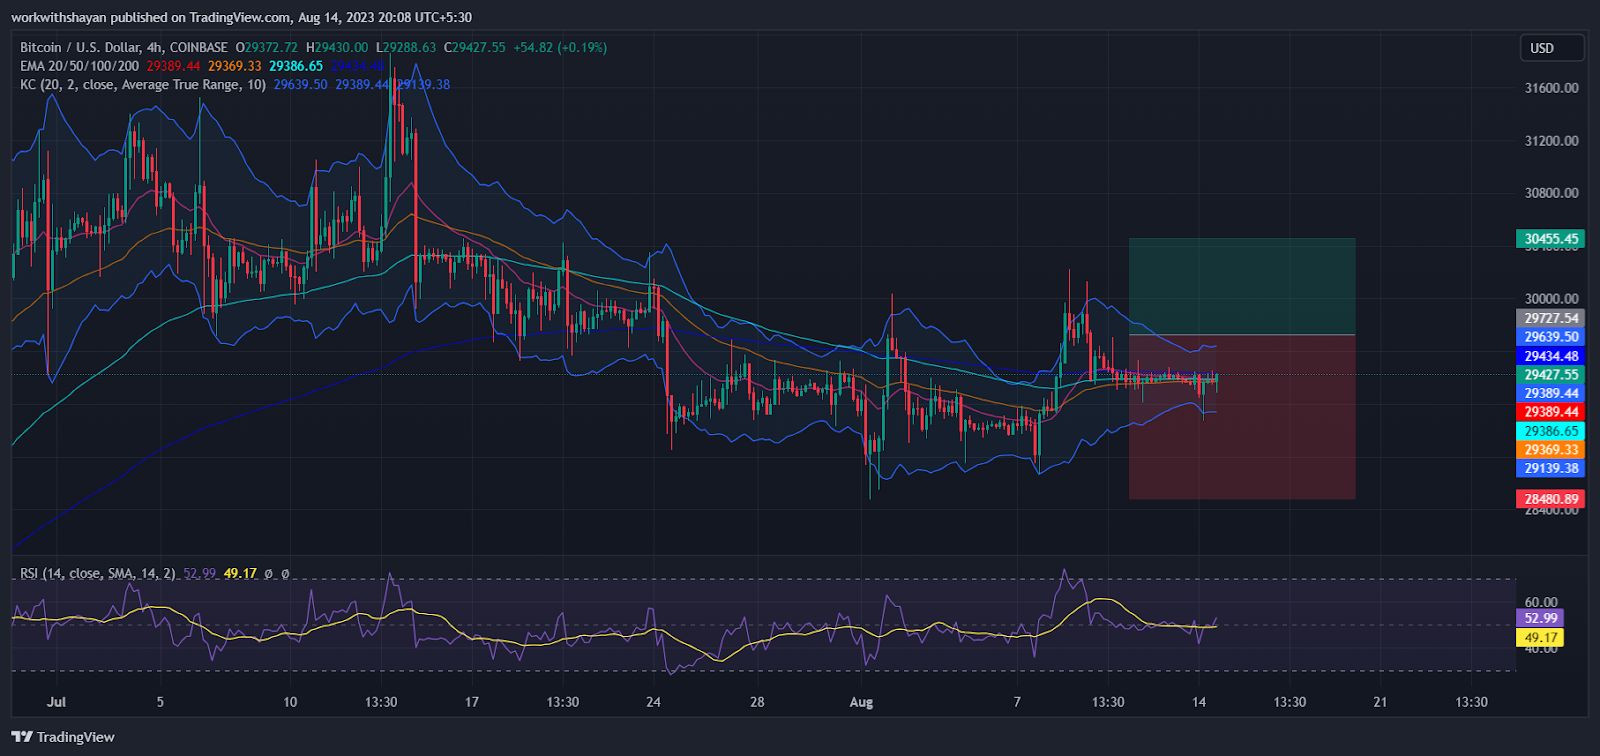
The nearly flat moving averages and the RSI close to the middle suggest no clear dominance of either bulls or bears. This might result in the BTC price remaining within the $29,200 to $29,600 bracket for some time.
A robust move is anticipated once the price breaks out of this bracket. If the price falls below $29,000, sellers might intensify, potentially pushing the price down to $28,500. A breakdown at $28.3K will plunge the BTC price to $27,200.
Conversely, if the price surpasses $30,200 and maintains its momentum, it could lure in more buyers. This might send the price towards the resistance area between $30,500 and $31,800. However, it is expected that the BTC price will consolidate within the current tight region for a few more days.
