


Bitcoin remains stuck inside a narrow range, making it difficult to predict the direction of the next possible breakout. The U.S. Dollar Index (DXY), which generally moves in inverse correlation to Bitcoin (BTC), dropped below 100, but that has failed to propel Bitcoin higher. This suggests that Bitcoin is charting its own course in the near term.
Therefore, the earnings season from big companies this week may sway equities markets in the United States but may not have the same effect on Bitcoin. It is becoming increasingly difficult to pinpoint the event or the news flow that will cause Bitcoin’s price to escape the range.
The uncertainty about Bitcoin’s next directional move has not deterred the whales. CryptoQuant’s contributing analyst SignalQuant highlighted that one on-chain indicator, the unspent transaction outputs, has been rising in 2023, similar to the increase seen in 2019. If the indicator continues to rise, it will suggest that Bitcoin has room to run and the low made in late 2022 was a long-term bottom.
Could the DXY stage a recovery? Will that limit the upside in Bitcoin and the major altcoins? Let’s analyze the charts to find out.
S&P 500 Index price analysis
The S&P 500 Index (SPX) is in a strong uptrend. The price has reached resistance at 4,513, which may act as a minor hurdle. But if bulls do not give up much ground from the current levels, it will suggest that traders expect the rally to continue.
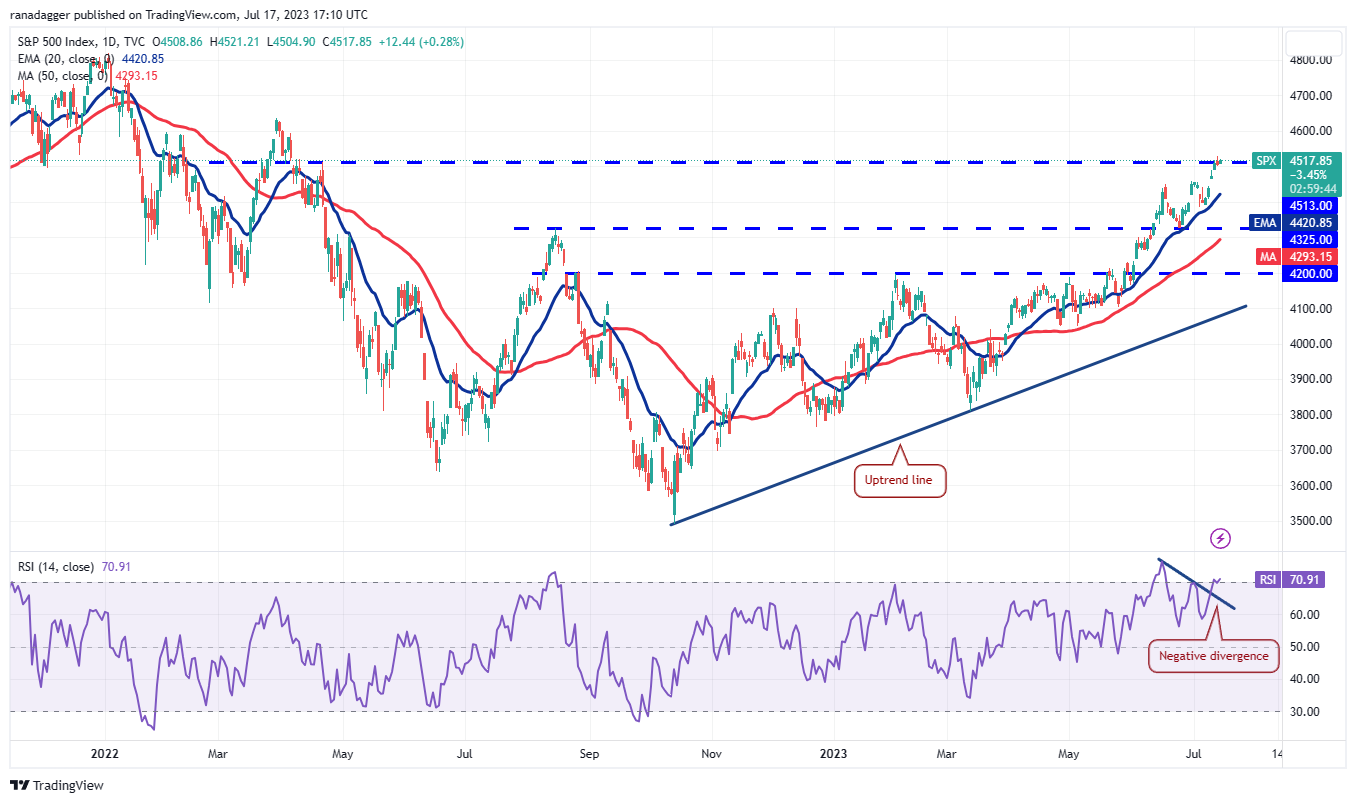
The developing negative divergence on the relative strength index (RSI) has been negated, indicating that the bulls remain in command. If buyers thrust and sustain the price above 4,513, the index could resume its uptrend and reach 4,650. This level may again act as a strong barrier.
On the way down, the 20-day exponential moving average (EMA) of 4,420 is the important support level to watch out for. If this support gives way, it will signal that the bulls may be booking profits. That may sink the price to the 50-day simple moving average (SMA) of 4,293.
U.S. Dollar Index price analysis
The U.S. Dollar Index broke below the moving averages on July 7 and continued its downward spiral. The bears yanked the price below the vital support at 100.82 on July 12, completing a bearish descending triangle pattern.
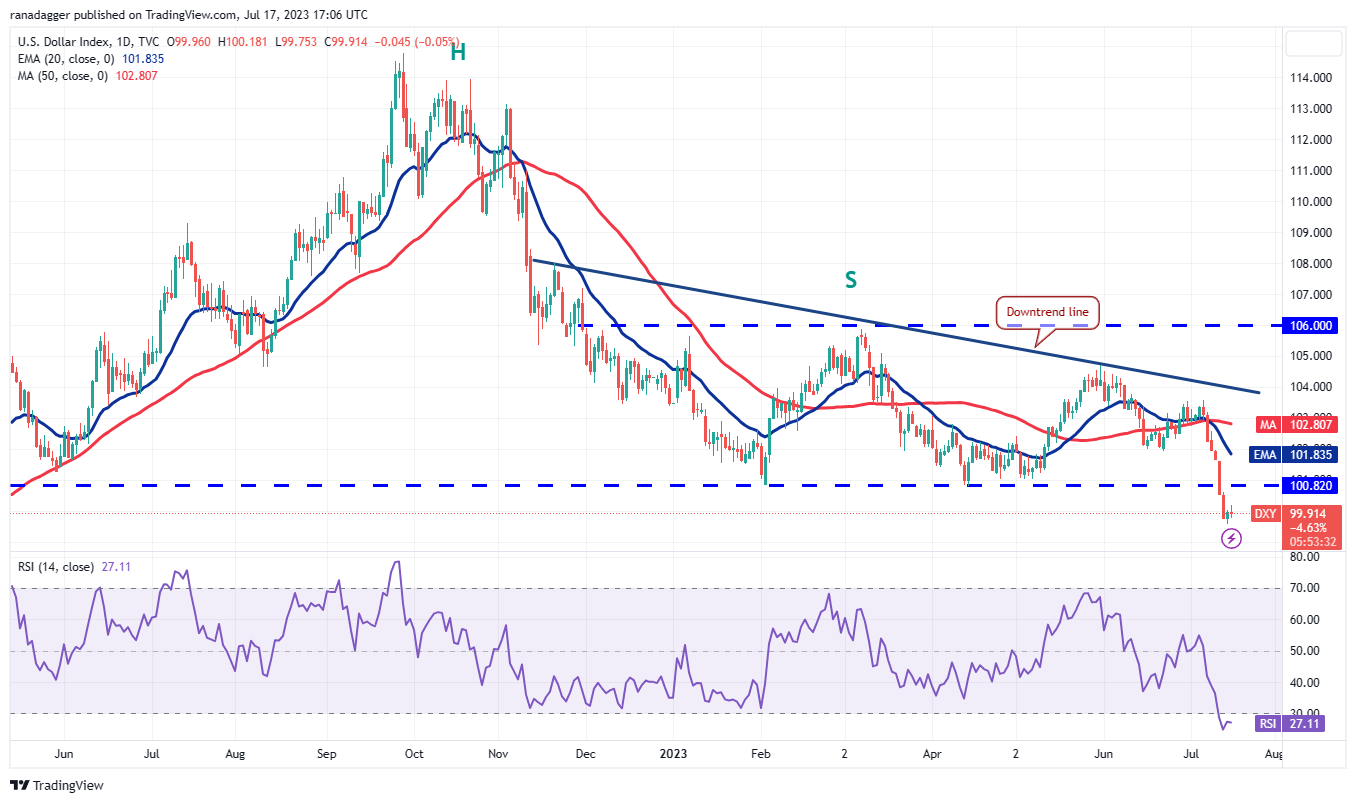
The sharp fall of the past few days has sent the RSI into the oversold territory, indicating that a minor recovery is possible. If the price turns up from the current level, the index could retest the breakdown level of 100.82.
This remains the key level to watch for. If the price turns down from this level, it will suggest that the bears have flipped the previous support into resistance. That could start a downtrend, which could reach 97 and then collapse toward the pattern target of 93.64.
If bulls want to prevent the decline, they will have to quickly push and maintain the price above 100.82.
Bitcoin price analysis
Bitcoin bulls have defended the 20-day EMA ($30,173) for the past three days, but a negative sign is that they have failed to start a strong bounce off it. This suggests a lack of aggressive demand at current levels.
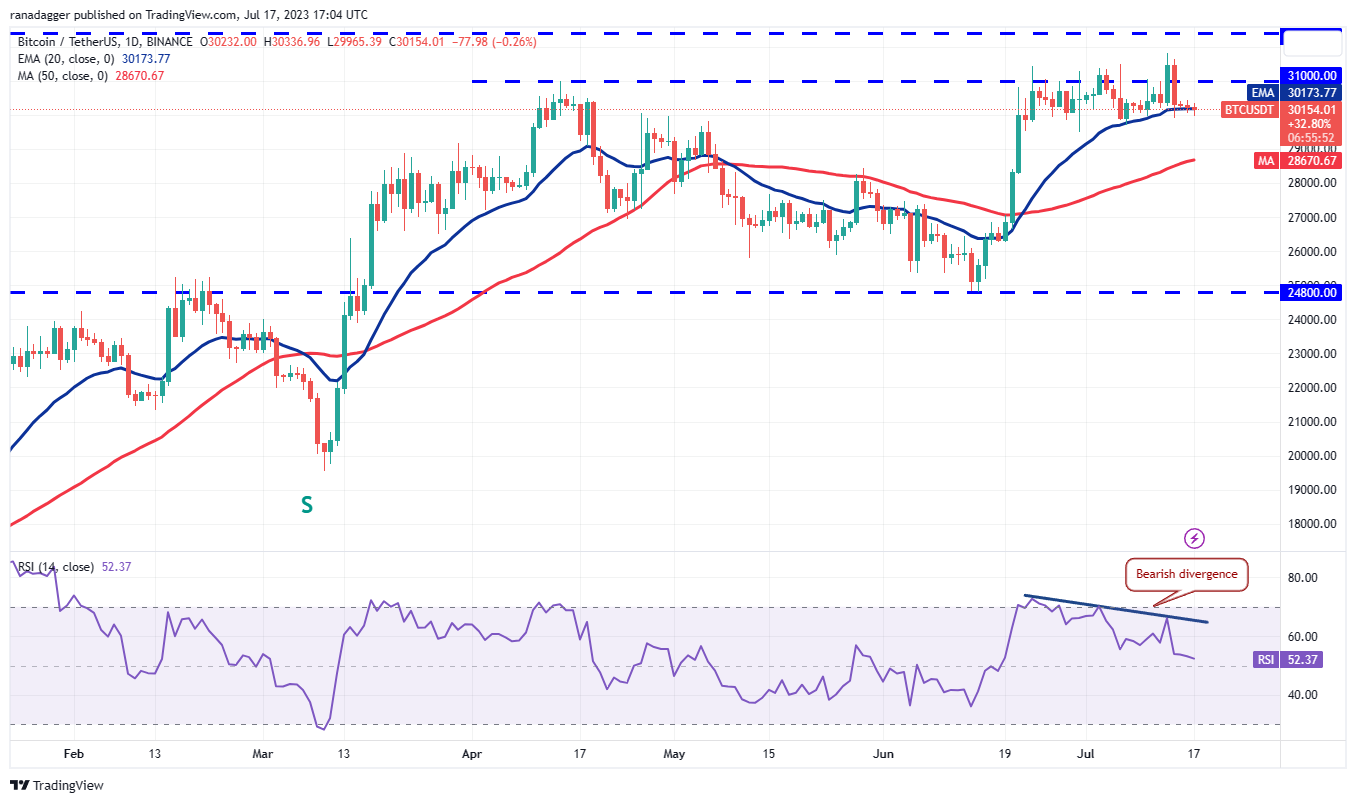
The 20-day EMA has started to flatten out and the RSI is just above the midpoint, indicating a balance between supply and demand. That could keep the pair inside the tight range of $29,500 and $31,500 for a while longer.
Buyers will have to shove the price above $32,400 to signal the start of the next leg of the uptrend. The BTC/USDT pair could then surge toward $40,000. Instead, if the price tumbles below $29,500, the pair may skid to the 50-day SMA ($28,671).
Ether price analysis
Ether (ETH) is trying to maintain above the 20-day EMA ($1,897), suggesting that the lower levels are attracting buyers.
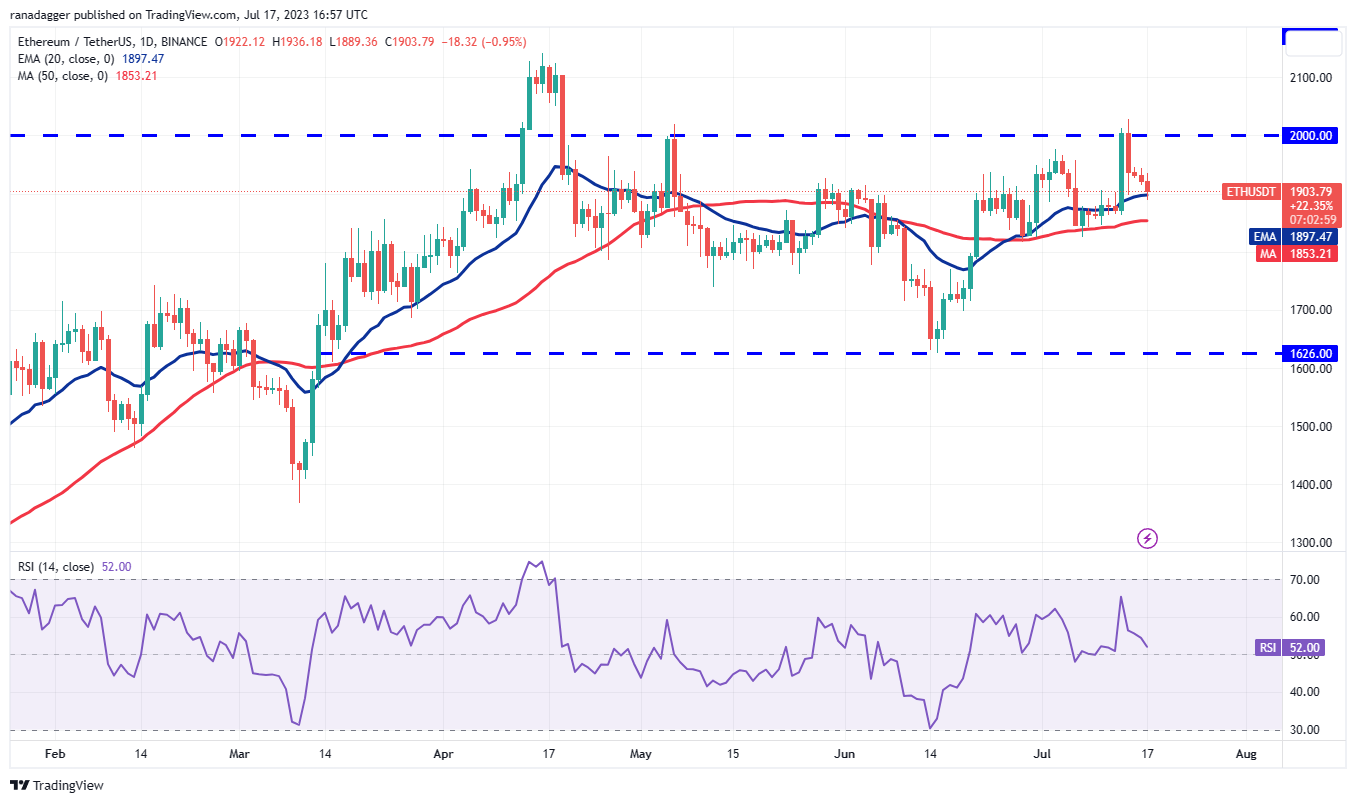
The bulls will try to push the price to the psychological resistance of $2,000. This remains the key level to keep an eye on because a break and close above it will clear the path for a possible rally to the $2,141 to $2,200 zone.
The crucial support to watch on the downside is the 50-day SMA ($1,853). If this level cracks, it will suggest that the ETH/USDT pair may remain inside the large range between $1,626 and $2,000 for some more time.
XRP price analysis
XRP (XRP) is finding support in the zone between the 50% Fibonacci retracement level of $0.69 and the 61.8% retracement level of $0.64.
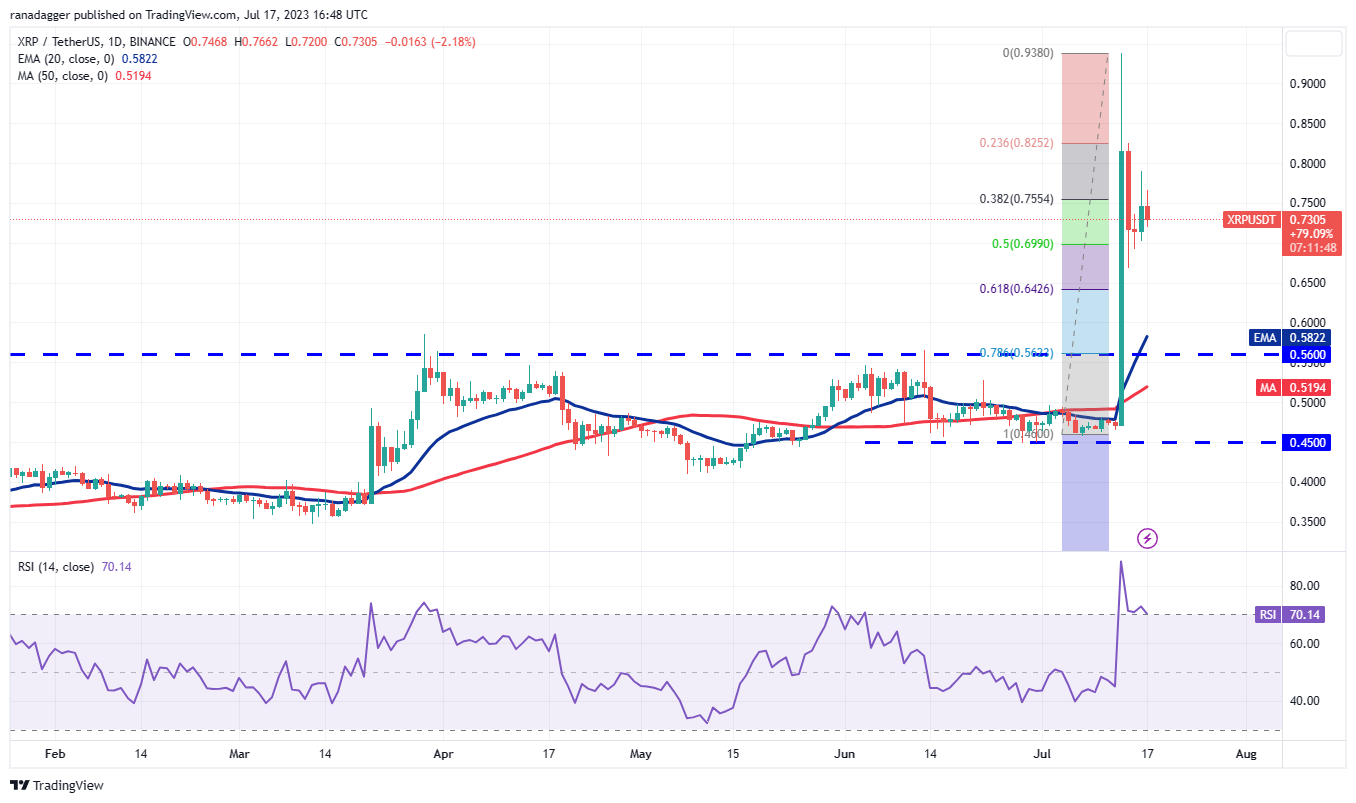
The bulls will try to resume the up move, but they may face formidable resistance at $0.83 and again at $0.93. If the price turns down from this zone, the XRP/USDT pair may remain stuck inside a range for a few days.
Another possibility is that the price turns down from the current level and breaks below $0.64. If that happens, it will signal an urgency among the bulls to exit their positions. That could sink the pair to the 20-day EMA ($0.58).
BNB price analysis
BNB (BNB) turned down from the 50-day SMA ($253) and reentered the symmetrical triangle pattern on July 14. This shows that the bears are fiercely defending the overhead resistance at $265.
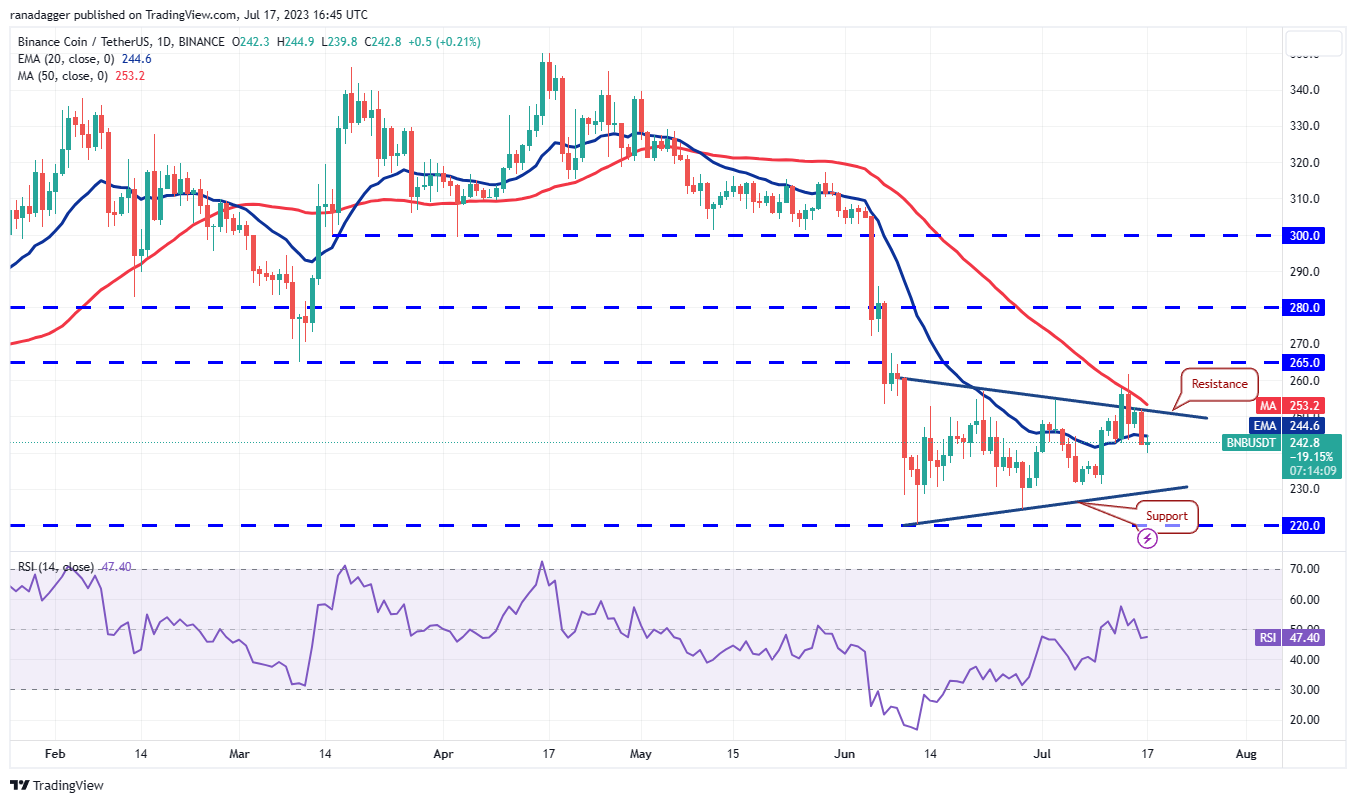
The 20-day EMA ($244) has flattened out and the RSI is just below the midpoint, indicating a balance between supply and demand. The BNB/USDT pair could oscillate inside the triangle for a few more days.
Buyers will have to propel and maintain the price above the triangle to gain the upper hand. The momentum could pick up after the bulls kick the price above the overhead resistance at $265. Alternatively, a break below the triangle will signal that the bears are back in the driver’s seat. The pair could resume its downtrend below $220.
Solana price analysis
Solana (SOL) formed an inside-day candlestick pattern on July 15 and 16, which suggests short-term uncertainty about the next directional move.
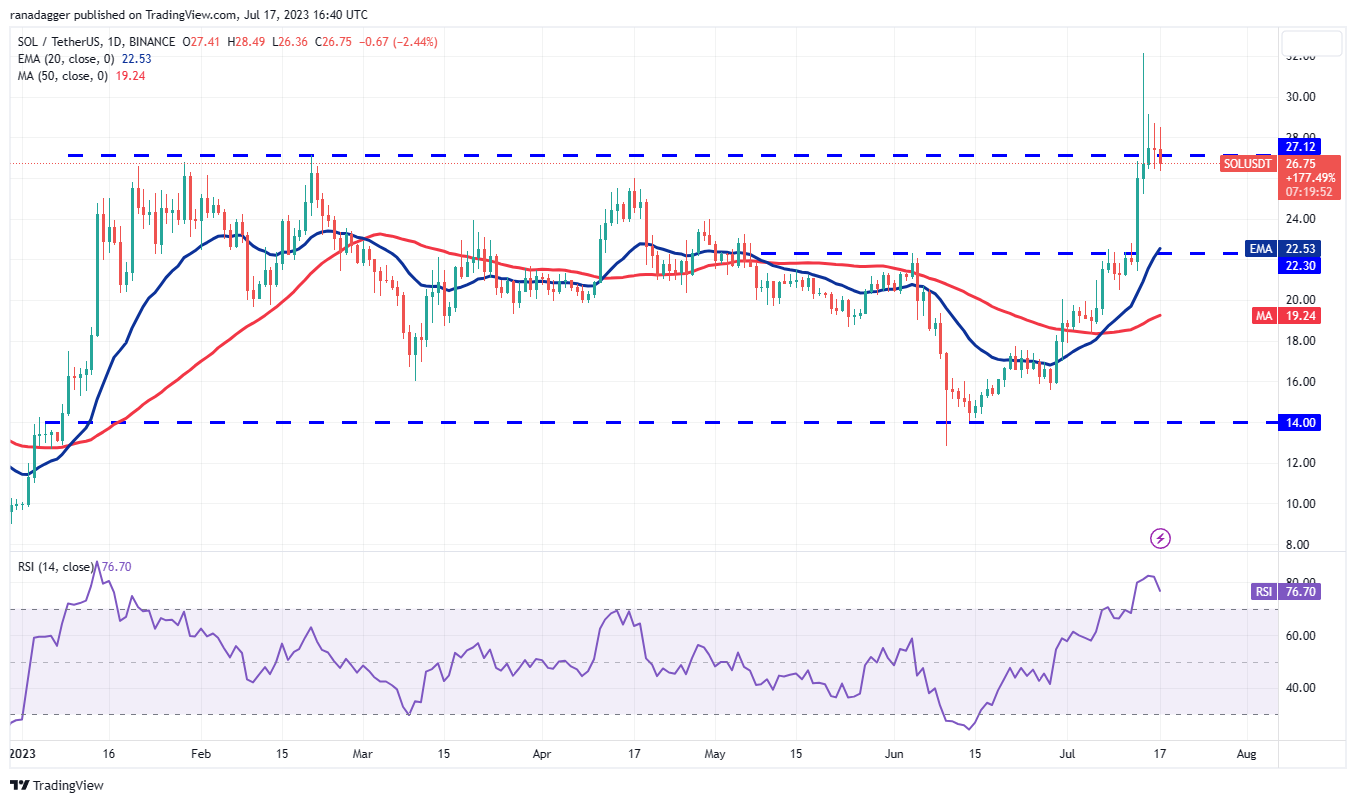
Generally, the tightening of the range is followed by a sharp breakout. If buyers thrust the price above $29.12, the SOL/USDT pair could jump to $32.13. A rally above this level could open the doors for a further rise to $38.
Contrarily, if the price turns down and plunges below $26, it will suggest that the advantage has tilted in favor of the bears. The pair could first slide to $24 and thereafter to the 20-day EMA ($22.53).
Related: Bitcoin ‘full breakout’ not here yet as BTC price spends month at $30K
Cardano price analysis
Cardano’s (ADA) pullback has reached near the breakout level of $0.30. Usually, such a deep correction delays the start of the next leg of the up move.
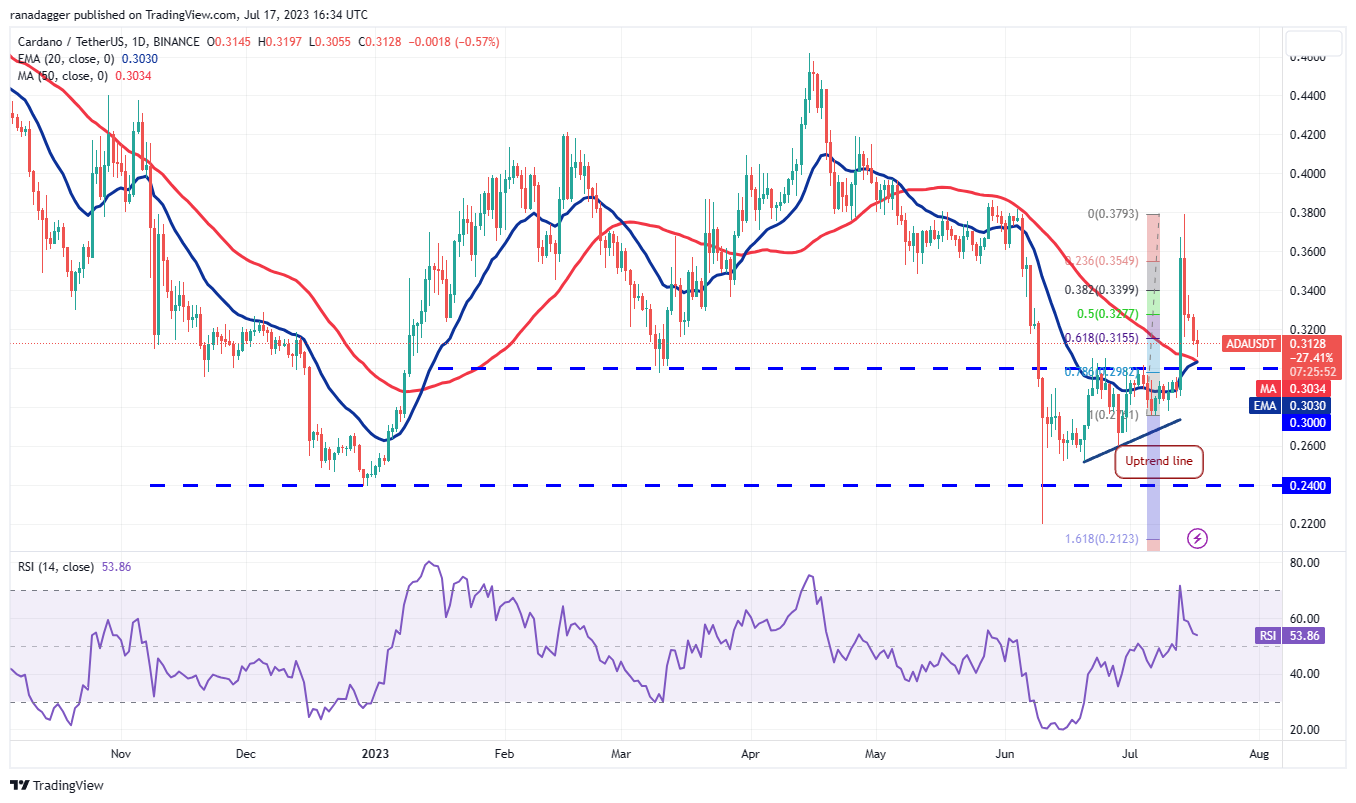
However, the moving averages are about to complete a bullish crossover and the RSI is in the positive territory, indicating that bulls have a slight edge. If the price turns up from the current level, buyers will again try to drive the ADA/USDT pair to the overhead resistance at $0.38.
It is unlikely to be an easy path higher for the bulls. The bears will try to stall the recovery at $0.34 and again at $0.36. On the downside, a break and close below $0.30 could tilt the advantage in favor of the bears.
Dogecoin price analysis
Dogecoin (DOGE) is witnessing a tough battle between the bulls and the bears near the overhead resistance at $0.07.
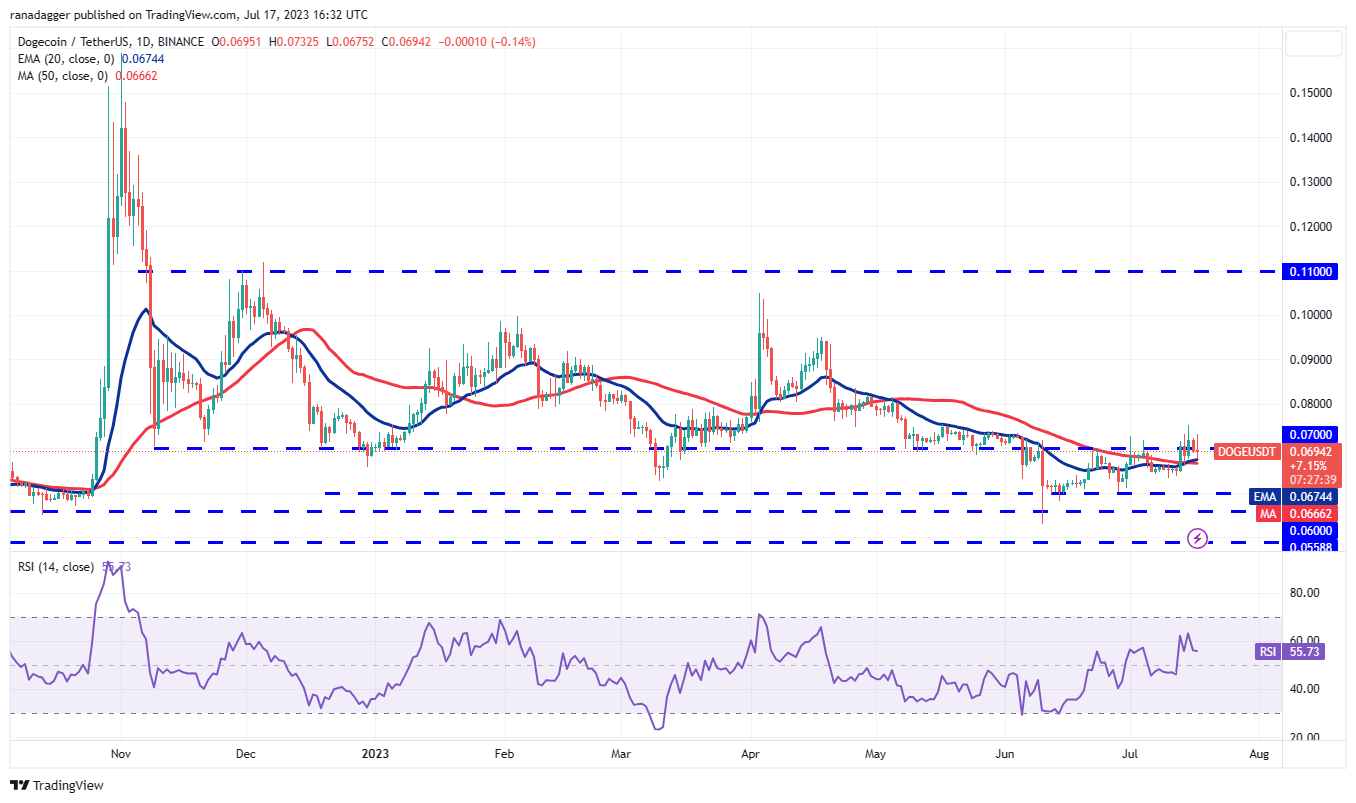
The 20-day EMA ($0.07) has started to turn up and the RSI is in the positive territory. This suggests that the bulls have a slight edge. The bulls will try to propel the price to $0.08, where the bears may again mount a strong defense.
Contrary to this assumption, if the price turns down and breaks below the moving averages, it will suggest that bears continue to sell on rallies. That could keep the DOGE/USDT pair stuck inside the $0.06 to $0.07 range for some more time.
Polygon price analysis
Usually, the price turns down and retests the breakout from a pattern, and Polygon (MATIC) is doing just that. The price could drop to $0.72.
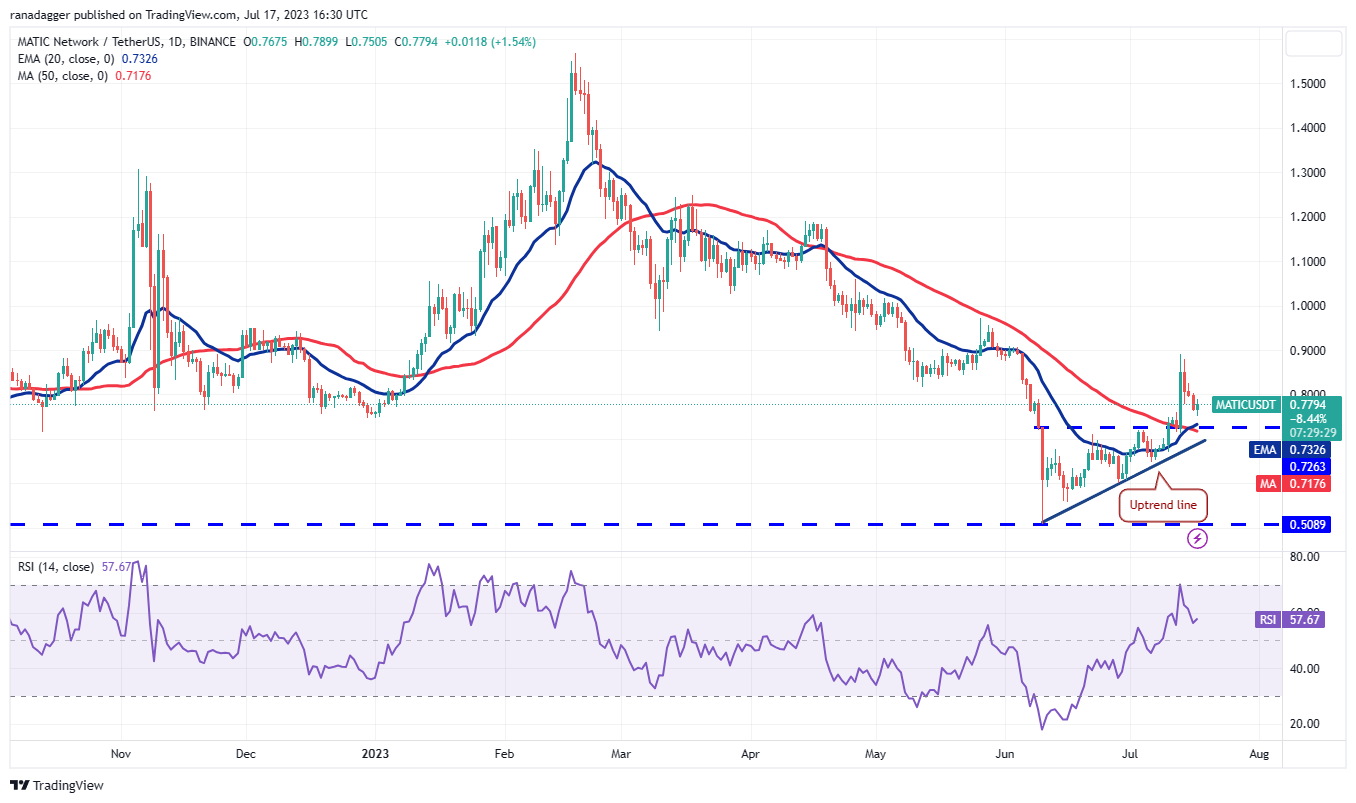
If the price rebounds off $0.72 with strength, it will suggest buying at lower levels. The bulls will then try to push the price above the overhead resistance of $0.90. If they do that, the MATIC/USDT pair could start the next leg of the up move. The first stop could be the psychological resistance of $1 and subsequently $1.20.
This positive view will be invalidated if the price continues lower and plummets below the uptrend line. The pair could then slump to $0.60.
This article does not contain investment advice or recommendations. Every investment and trading move involves risk, and readers should conduct their own research when making a decision.
