
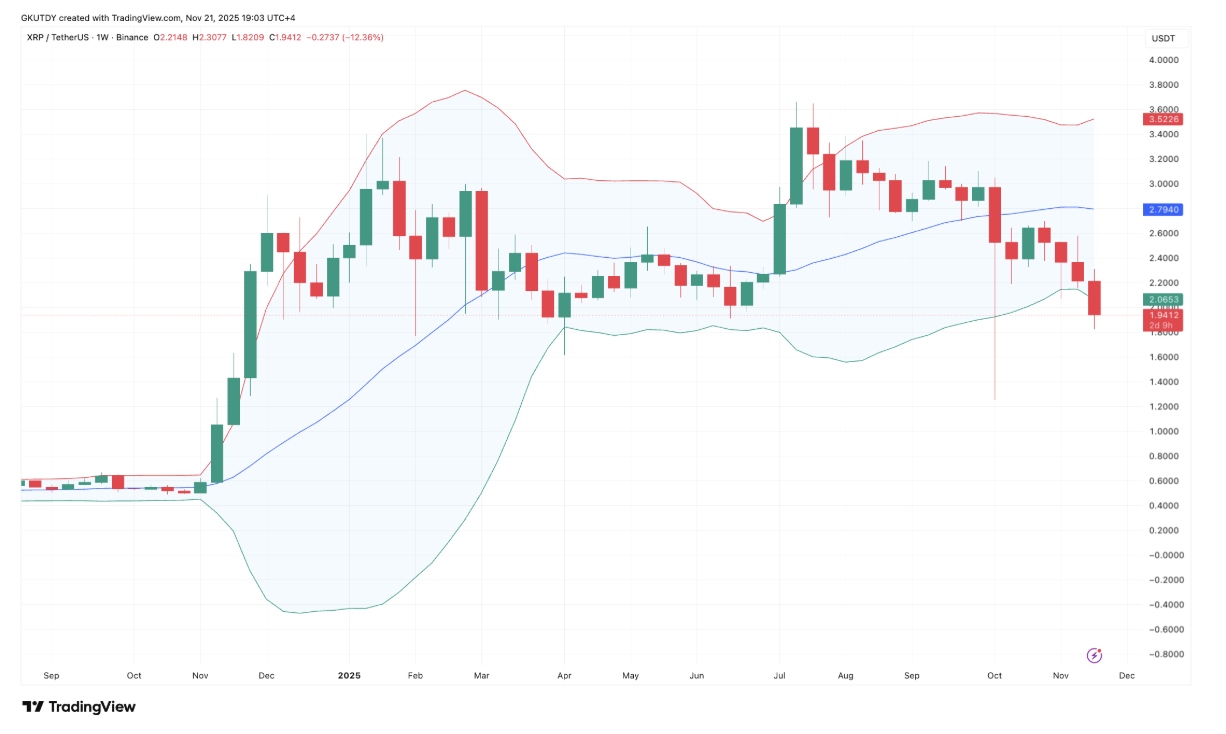
The trading sessions of the last week appeared to be a one-way liquidation tunnel for XRP. Many investors interpreted the price’s decline below the $2 level as a harbinger of a dramatic crash. However, when you look closely at the weekend charts, the picture changes completely. According to TradingView, Bollinger Bands on wider time frames do not show any signs confirming this panic in the market. On the contrary, XRP price movements appear to have entered a structure consistent with historical reversal zones.
Weekly and Monthly Charts Do Not Support Panic Mood
What actually happened is quite simple: the XRP price did not freefall into the gap. It touched the lower band on the weekly chart, and was positioned just above the middle band on the monthly chart. This behavior is generally seen when investors who sell late in panic completely withdraw from the market and the market touches levels known as the “exhaustion zone”. A careful look at the weekly chart shows that the lower band catches the price candle almost perfectly. This situation repeated itself in previous cycles and XRP started strong recoveries immediately after the so-called “over” periods.
Short-Term Outlook May Mislead Investors
The monthly chart further strengthens the situation. The mid-band sits at around $1.73, and despite four challenging weeks, the XRP price is still holding that level. This suggests that the long-term trend has not yet broken down, only market sentiment has shaken.
Market sentiment often tends to get caught up in the complexity of the short-term outlook. Wicks, failed mid-band tests and volatility on daily and hourly charts can mislead investors. However, broad time frame indicators are critical elements that determine the actual structural direction. Currently, the broad timeframe shows that XRP has touched the lower volatility band after a multi-month hemorrhage. This contact has often marked the beginning of strong returns in the past.

On the other hand, a recent and similar development on the subject is Ethereum.  $2,736.07 It happened on the front. ETH price managed to maintain long-term support levels despite sharp pullbacks last week. Analysts suggest that short-term bottoms are strengthening for many assets that have reached similar oversold areas in the crypto market. Such indicators, when combined with the partial easing of macro pressures, can signal possible direction changes to investors.
As a result, although there has been a rapid demoralization in the XRP market in recent weeks, technical indicators show that the trend has not been broken yet. Panic selling has been one of the factors that triggered turning points many times in history. For this reason, the possibility of a strong recovery in the coming weeks for XRP, which maintains its technical structure over a wide time frame, should not be ignored.