largest altcoin Ethereum  $3,998.89It closed October 28 at $4,022, maintaining its critical support at $4,000. Trading volume in ETH, which completed the day with a 0.98 percent increase, exceeded the seven-day average by 35 percent. While technical indicators point to a double bottom formation formed at the $ 4,000 level, it is noticeable that buyers defended this region twice.
Arkham, BitMineHe withdrew approximately $113 million worth of ETH from Bitgo on October 28 and bought at the bottom. reported. In its press release dated October 27, the company reported that it had a total asset portfolio of $14.2 billion. Declared assets include 3,313,069 ETH, $305 million in cash and 192 small amounts of ETH BTC and owns $88 million worth of shares in Eightco.
BitMine’s Latest Ethereum Purchase
Bitmine Immersion Technologiesdid in the statement It described itself as the company with the world’s largest Ethereum treasury. The company reported that its five-day average dollar trading volume was $1.5 billion, ranking approximately 46th in U.S. exchanges by this metric. BitMine, 77,055 units in the last week ETH purchased more, increasing its total Ethereum holdings to 3.31 million ETH. This amount corresponds to approximately 2.8 percent of the ETH supply.
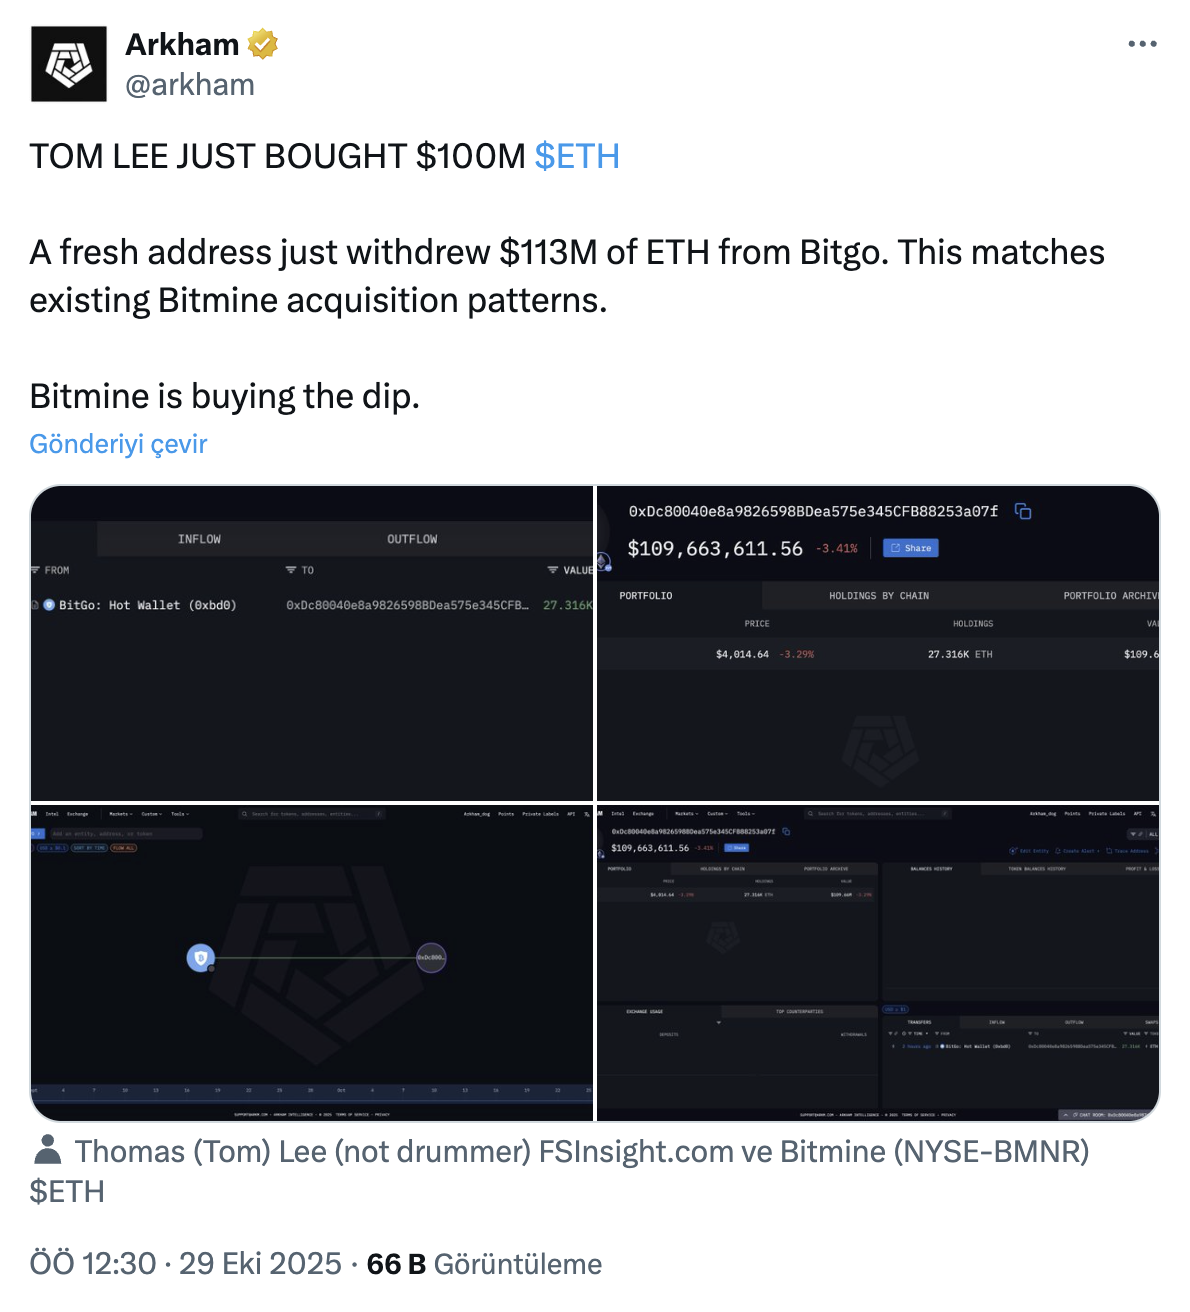
Chairman of the Company’s Board of Directors Thomas LeeHe stated that the easing in trade tensions between the USA and China may increase risk appetite. Lee said open interest in Ethereum futures has fallen to mid-year levels and described the current picture as attractive in terms of risk/reward.
According to analysts, while Ethereum’s hold on $4,000 keeps the upside potential alive in the short term, it is evaluated that if $4,250 is exceeded, the price may move to the $5,270-5,940 band.
Technical Outlook on ETH: Which are the Important Levels?
Technical models show that $4,000 is the main support in ETH, with other important supports located at $3,965 and $3,920. While the first target on the upside is the $4,050–$4,080 range, $4,200 stands out as the major resistance. It is stated that candle closes above $4,250 could trigger a strong bullish phase.
The activity, which reached 149 percent of the 24-hour average with a volume of 549,762 contracts in intraday transactions, showed that corporate repositioning continues. in the chart double bottom formation It is interpreted as a signal that sellers have weakened and buyers have re-engaged. On the ETFs side, there was a net inflow of 246.02 million dollars on October 28, the last trading day.