After months of consolidating near $3.50, the SUI price is now signaling strength for a potential major breakout. Growing accumulation, strong technical structure, and expanding on-chain activity all point toward renewed bullish momentum. Traders are eyeing a possible move toward higher resistance zones as momentum builds across the SUI crypto ecosystem.
SUI Price Chart Indicates Accumulation Near Key Levels
The SUI price chart on mid-timeframes reveals a steady consolidation range forming a strong support base around $3.50. This phase of accumulation has attracted renewed buying interest, hinting at the possibility of a breakout.
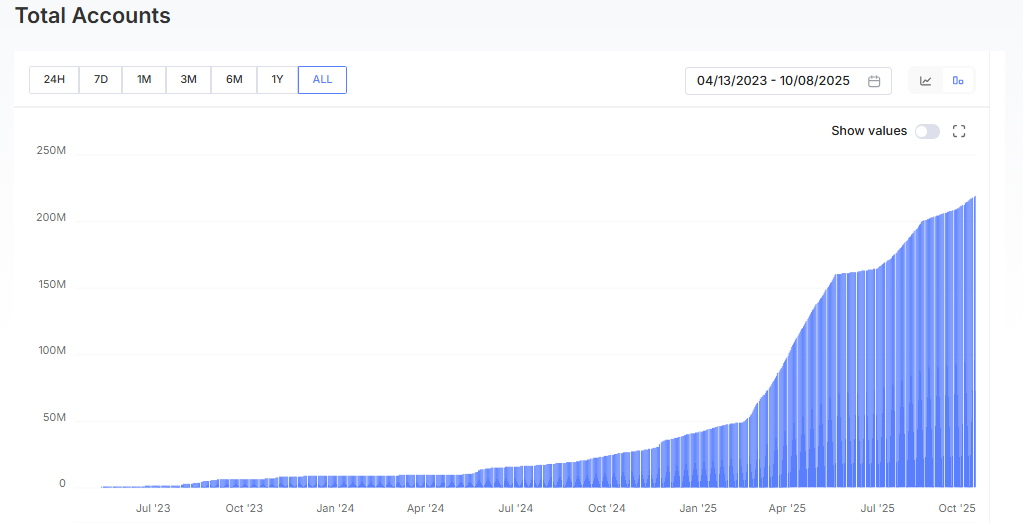
The consistent rise in trading volume and total accounts hitting an ATH further confirms increasing participation and investor confidence in SUI crypto.
DeFi Expansion Strengthens SUI Ecosystem
According to recent data, the total value locked (TVL) in the SUI network has reached $2.59 billion ATH, marking consistent daily growth. This increase reflects heightened activity in DeFi applications, exchanges, and cross-chain bridge protocols.
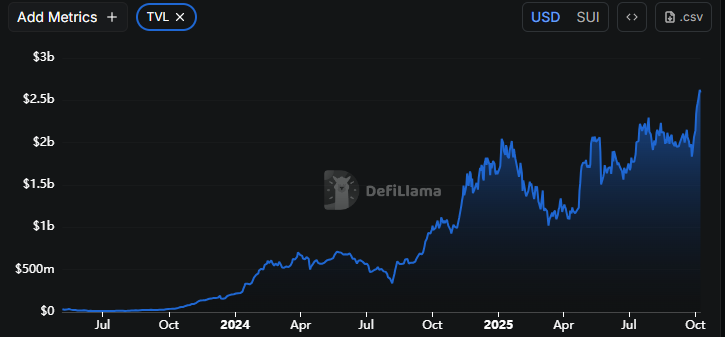
The expanding SUI price today is supported by rising network inflows, app revenues, and growing adoption across blockchain platforms.
Such fundamental progress continues to reinforce investor confidence and enhance SUI’s position in the competitive DeFi market.
Also, Social media sentiment around SUI crypto has turned distinctly bullish as trading volumes continue to rise. Recently, SUI even surpassed Hyperliquid in daily DEX volume, highlighting its growing dominance.
This surge in on-chain and trading activity mirrors the enthusiasm building within the market, supporting a potential SUI price breakout in the near term.
Nansen Partnership Boosts On-Chain Analytics
In a major development, Nansen has partnered with SUI Network to enhance its on-chain analytics infrastructure.
This collaboration provides users with real-time insights across one of the fastest-growing ecosystems, enabling traders and developers to gain a competitive edge.
This move is expected to attract institutional attention and strengthen transparency across the SUI price USD markets.
SUI Price Prediction: Breakout Setup Near Completion
Technically, the SUI price chart is showing a symmetrical triangle pattern. Market participants suggest that the current consolidation zone could serve as a “loading phase” before an upward breakout toward the $7 region.
The SUI price forecast therefore looks increasingly constructive as accumulation appears near completion, with the possibility of new all-time highs emerging once the breakout materializes.
Trust with CoinPedia:
CoinPedia has been delivering accurate and timely cryptocurrency and blockchain updates since 2017. All content is created by our expert panel of analysts and journalists, following strict Editorial Guidelines based on E-E-A-T (Experience, Expertise, Authoritativeness, Trustworthiness). Every article is fact-checked against reputable sources to ensure accuracy, transparency, and reliability. Our review policy guarantees unbiased evaluations when recommending exchanges, platforms, or tools. We strive to provide timely updates about everything crypto & blockchain, right from startups to industry majors.
Investment Disclaimer:
All opinions and insights shared represent the author’s own views on current market conditions. Please do your own research before making investment decisions. Neither the writer nor the publication assumes responsibility for your financial choices.
Sponsored and Advertisements:
Sponsored content and affiliate links may appear on our site. Advertisements are marked clearly, and our editorial content remains entirely independent from our ad partners.