


Despite a bearish influence, the crypto industry experienced a significant uptrend during February, with many altcoins recording a gain of over 100% in their respective portfolios and is on the verge of completing the month positively.
The rising bullish sentiments indicate a sharp rise in the investor’s interest in it. This article consists top 5 altcoins that have the potential to record significant gains this week.
Worldcoin (WLD):
The Worldcoin price started trading in February with a price tag of $2.328 and displayed a neutral trend for a brief period, indicating a disinterest of the investors in this token. As the market volatility grew in mid-February, the WLD token displayed a notable run over the next ten days by adding approximately 291% in valuation.
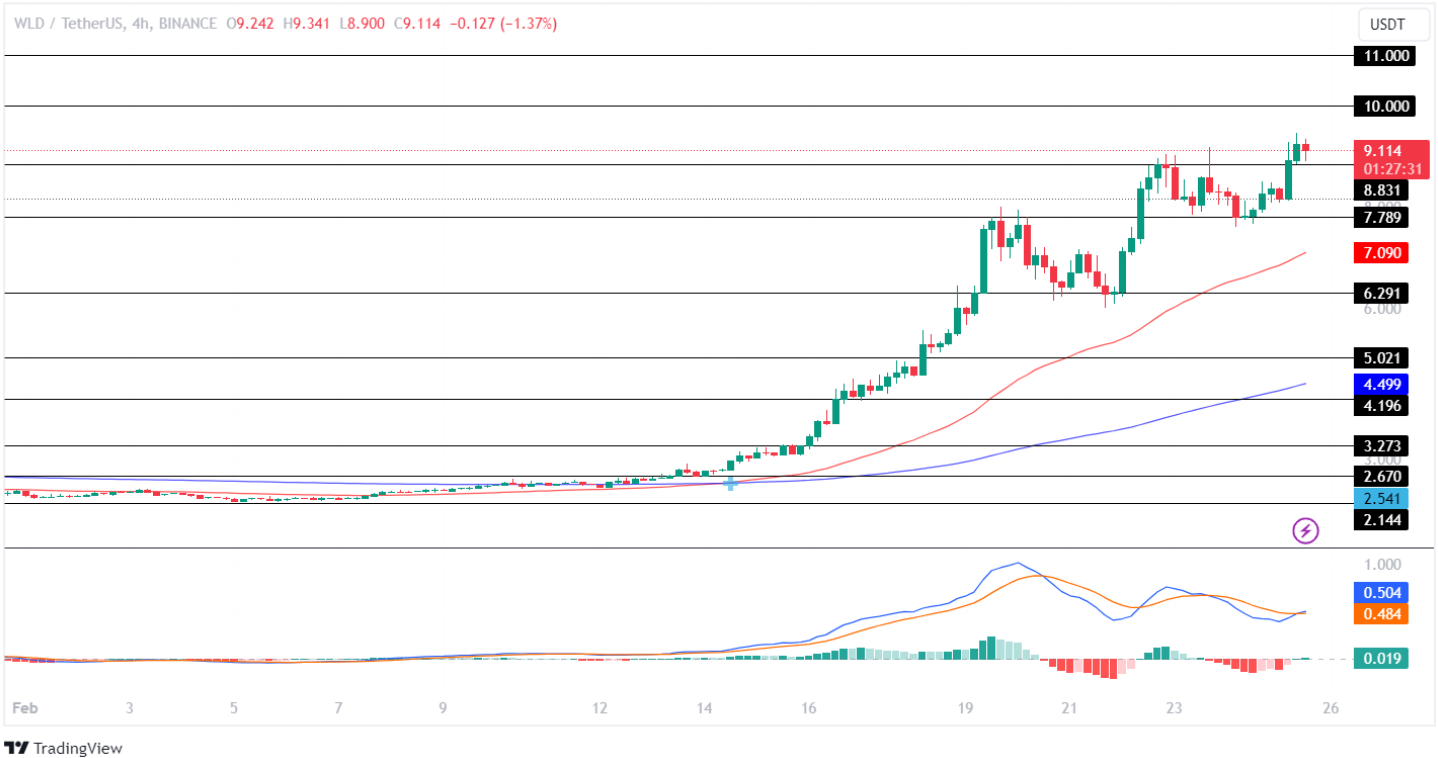
Currently, the WLD price is trading with a tag of $9.114, has a circulating supply of 135,247,618 WLD tokens, and a market cap of $1.238 Billion. The altcoin is predicted to test its upper resistance level of $11 by the month-end, hinting at a 20% gain over the next few days.
The Moving Average Convergence Divergence (MACD) displays a rising green histogram, indicating increased buying pressure within the crypto market. Further, the averages show a bullish convergence, suggesting the price will continue gaining value in the coming days.
Fetch.ai (FET):
The FET token entered the second month on a bearish note by recording a loss for the first few days. However, the bulls regained momentum and recorded a jump of over 88% over the next few weeks, highlighting a strong bullish sentiment for the coin in the market.
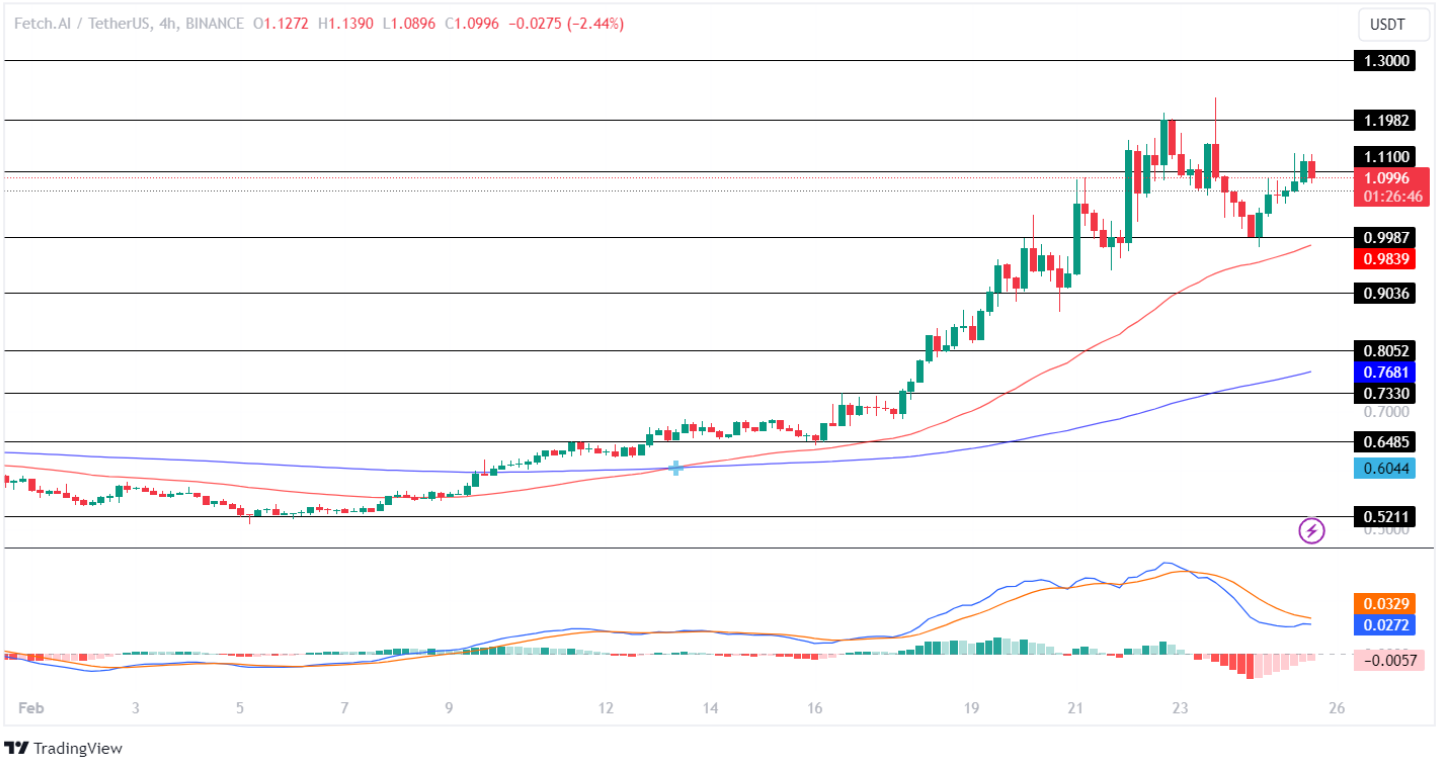
The Fetch.ai (FET) has a price tag of $1.0996, with a circulating supply of 831,852,395 FET tokens and a market cap of $931.56 Million. The current market sentiments hint at a potential 16% jump this week, making it a hot pick for this list.
The MACD shows a constant decline in the histogram, indicating an increase in the price action in the market. Moreover, the averages display a high possibility of a bullish convergence, suggesting a positive price action for the coin in the coming days.
SingularityNET (AGIX):
The SingularityNET token has Year-to-Date (YTD) returns of over 143%, indicating a rising interest of investors in it. Further, the AGIX price has recorded significant price fluctuations this month, resulting in it gaining significant attention from the market.
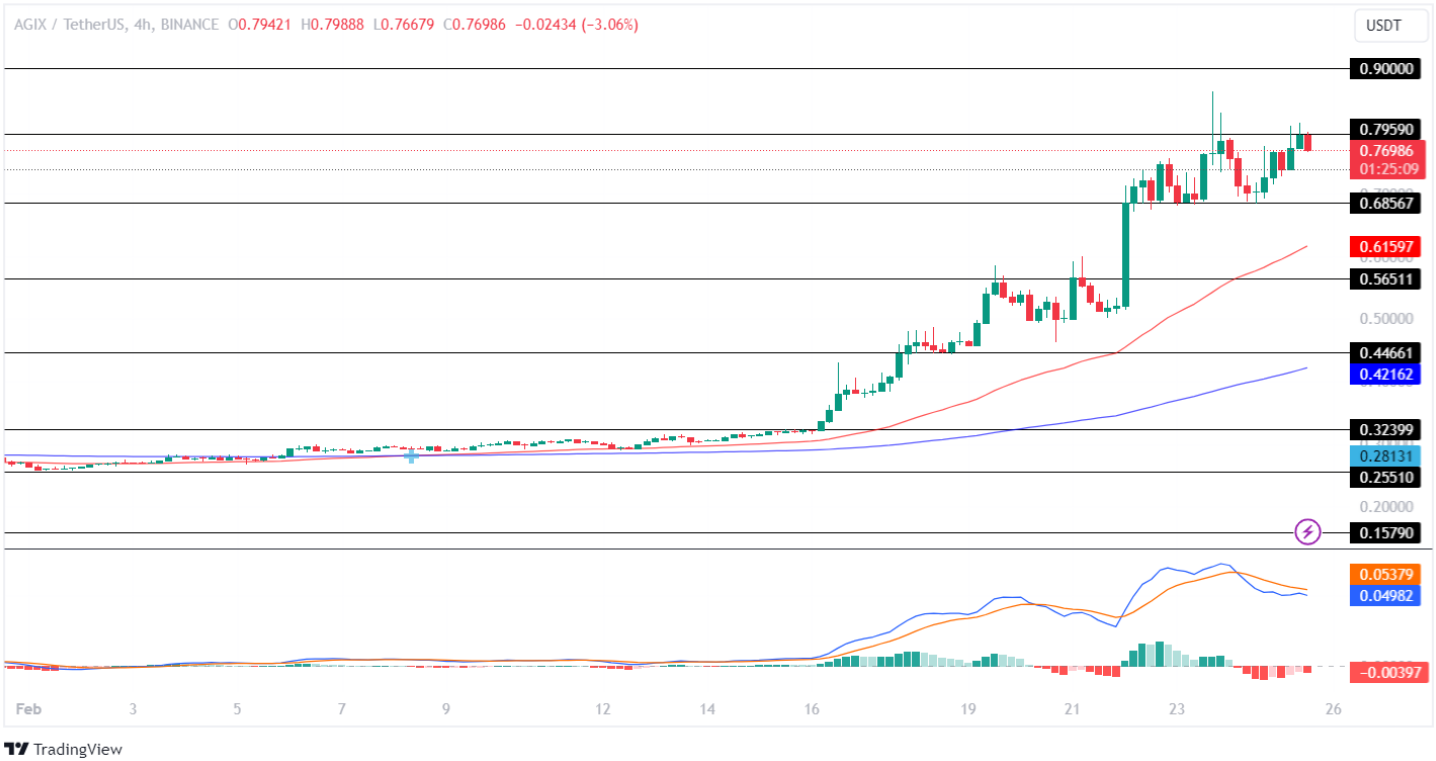
The AGIX token has recorded a jump of over 182% this month, making it one of the top gainers in the industry. With a circulating supply of over 1.256 Billion tokens and a market cap of $980.18 Million, the SingularityNET token is predicted to test its upper limit of $0.90 within this week.
The technical indicator displays a mixed sentiment as its Cross EMA 50/200-day shows a bullish momentum, whereas its MACD hints at a bearish price action in the coming time.
The Graph (GRT):
The Graph price traded in a consolidated range between $0.1495 and $0.1764 for the first two weeks of the month, following which the market experienced a bullish reversal, resulting in the GRT token experiencing a jump of over 90% in valuation. Further, it has added over 68% this year to its portfolio, making it a potential coin for the upcoming bull rally.
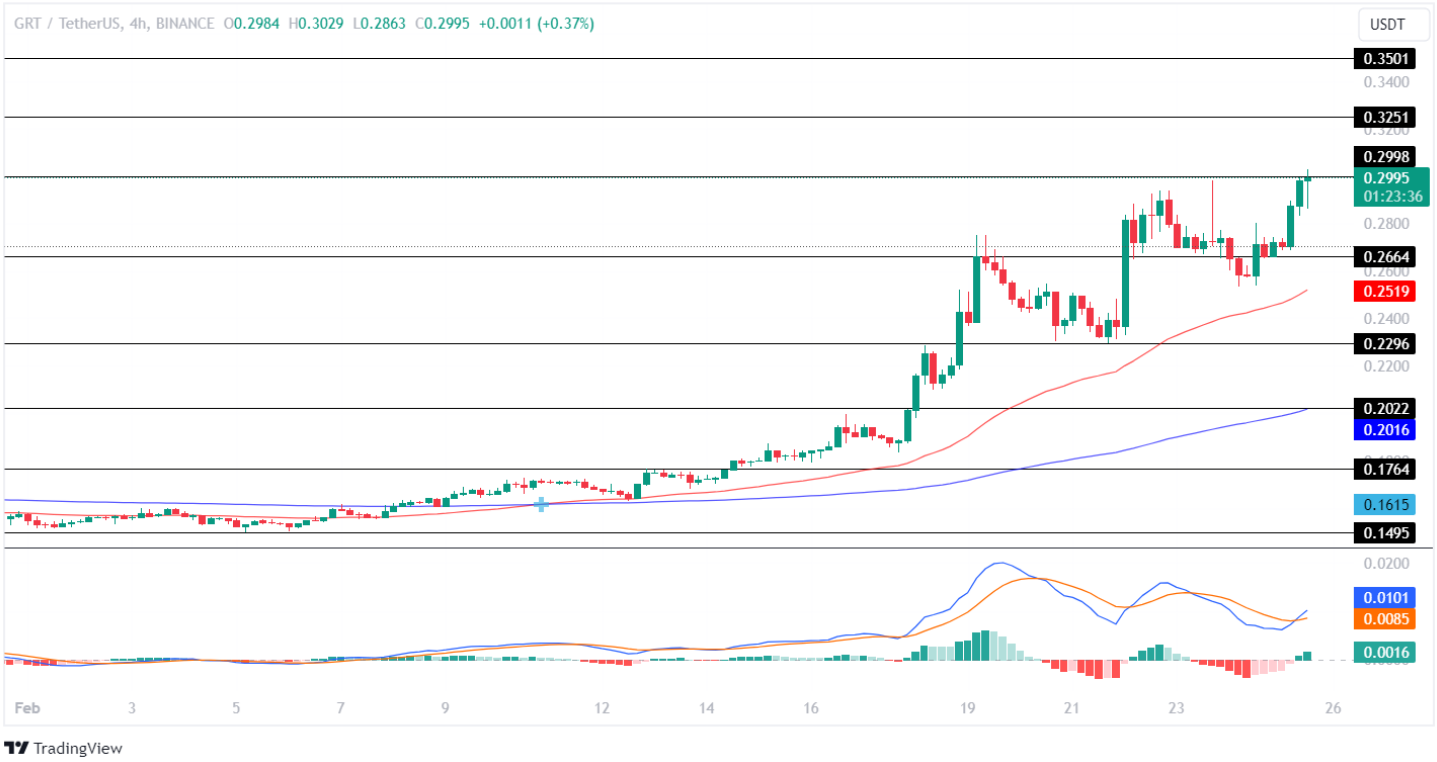
The Graph currently has a price tag of $0.2995 and a market cap of $2.803 Billion. With a circulating supply of 9,417,231,497 GRT tokens, the price is predicted to test its upper resistance level of $0.350, hinting at a potential-jump of 17% this week.
The MACD displays a rising green histogram, highlighting a positive price action for the coin in the market. Further, the averages show a bullish convergence, suggesting the price will continue gaining value in the coming time.
Render (RNDR):
The Render price traded in a consolidated range between $4.254 and $5.156 for the first sixteen days, after which the market gained momentum, and the token displayed significant fluctuation in the chart. Further, the RNDR token has added 73.50% this month.
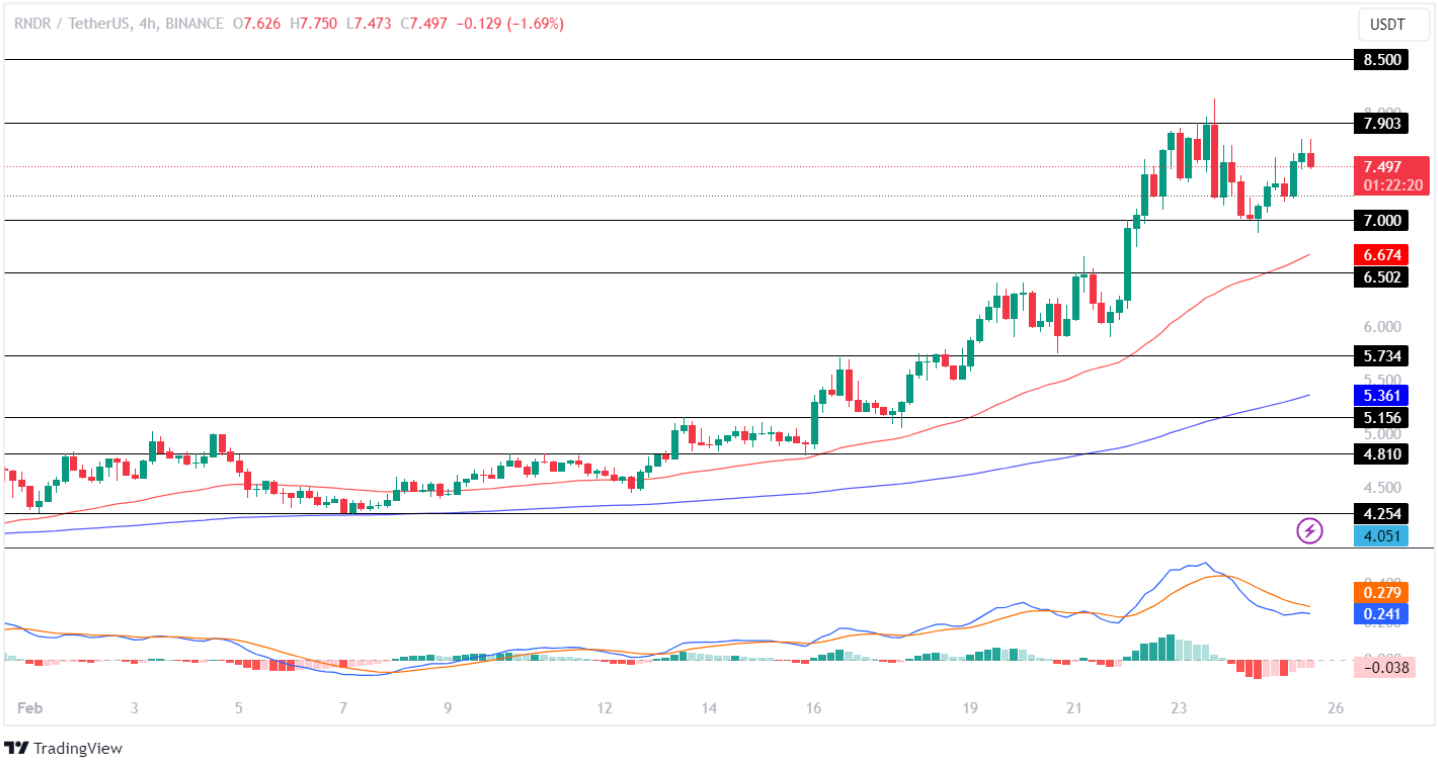
It has a price tag of $7.497, with a circulating supply of 387,257,447 RNDR tokens and a market cap of $2.848 Billion. The RNDR token has recorded a YTD of over 68%, making it a hot pick for this list. Further, the Render token is expected to test its upper level of $8.50 this week.
The technical indicator, MACD, displays a decline in the red histogram, indicating a rise in the buying pressure for this altcoin in the crypto market. Moreover, the averages show a high potential for a bullish convergence, suggesting a positive price action in the coming time.
