
Famous analyst detecting a reversed bear flag formation in the price graph in the three -day time period Peter BrandtOn social media on 3 July 2025 Bitcoin $109,658.18 He surprised his investors and made them think. At first glance, it was understood that the formation, which gave a harsh decline signal, was actually a rise formation stuck in the support zone. Brandt’s reversed graph shows how the prejudice can be misleading in graphics reviews, while the level of $ 109,000 is a strong bottom for horizontal movement. If this level is preserved, the target is 115 thousand – 118 thousand dollars band. In a possible decline to be triggered by breaking the bottom of 109 thousand dollars, the range of 98 thousand – 100 thousand dollars stands out
118 thousand dollars target in the rise scenario
Brandt’s sharing It reflects that the decline structure, known as the bear flag, is actually rise consolidation. While those who read the graph straight in the charter, the rising wedge is a signal of a decrease, it is understood that this structure is actually a sign of the upward break.
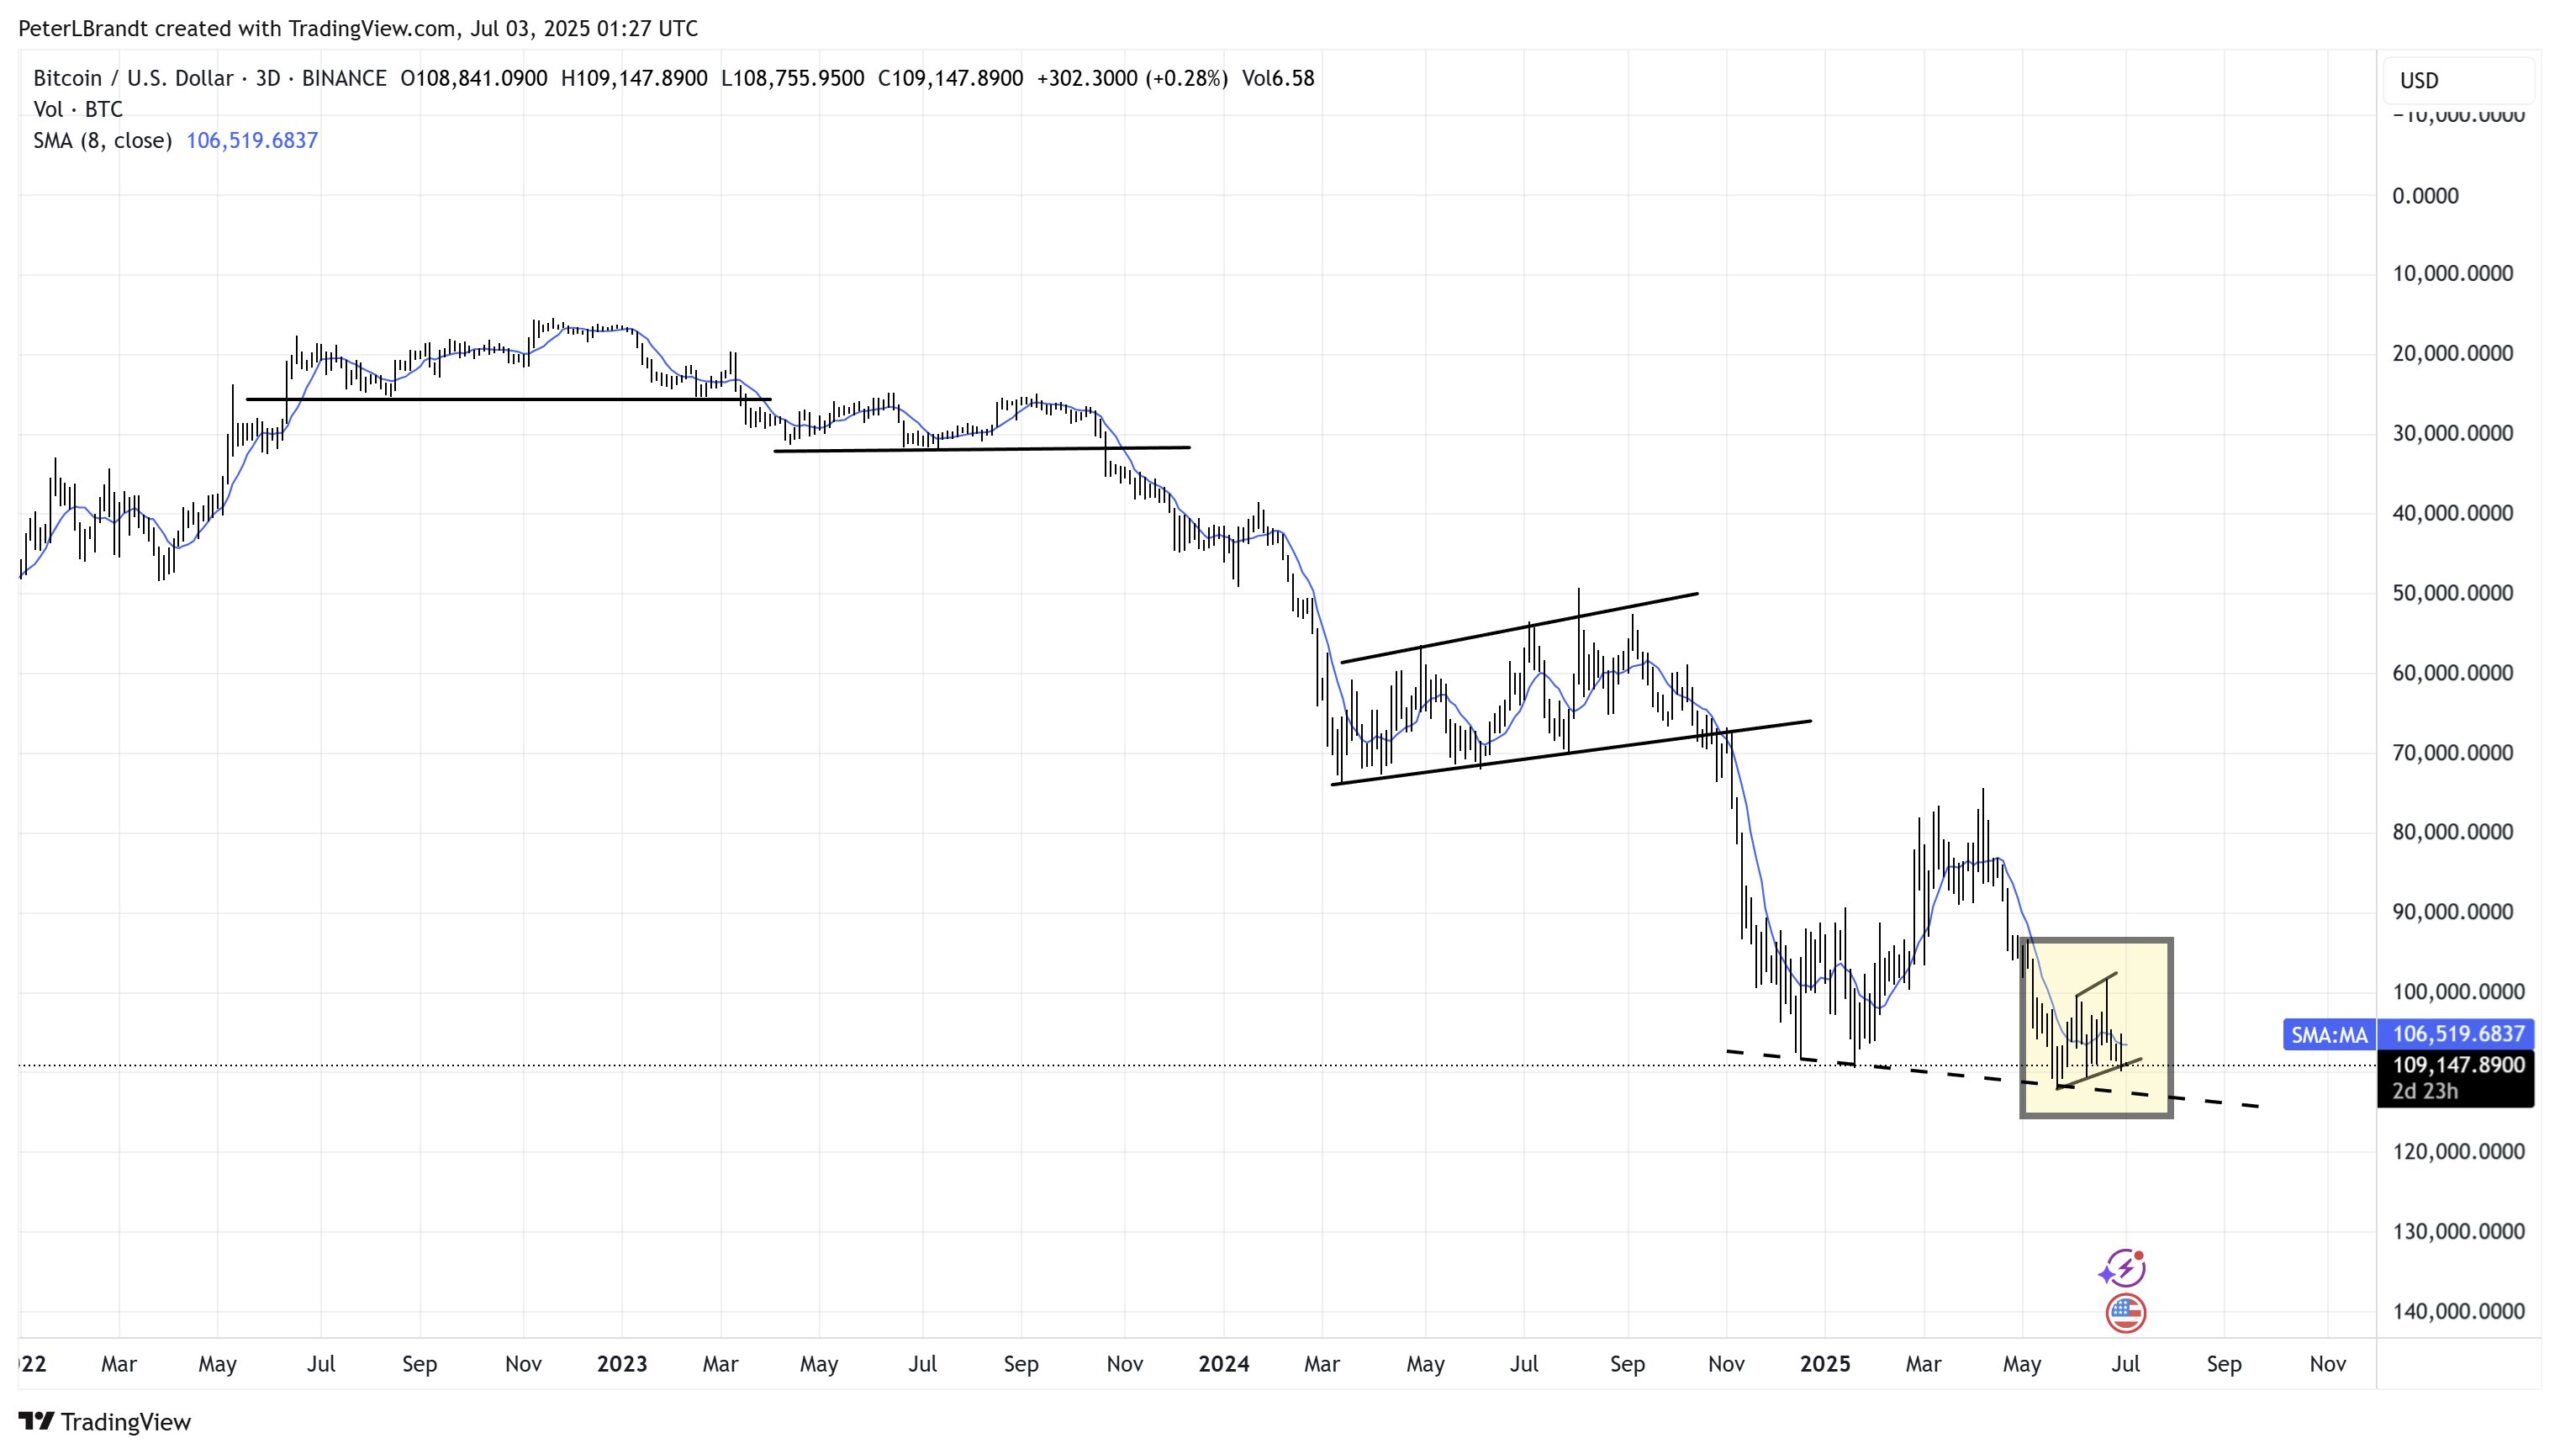
The analyst’s interpretation confirms the support line of Bitcoin, which has been traded over 109,000 dollars at the time of the news, has been maintained since June 16. Horizontal, low volatility period in the past as well as pre -rally energy collection process came to the fore.
From a technical point of view, if the consolidation zone is protected without breaking, a quick attack can be expected to the first target over 115 thousand dollars. Then there is a psychological resistance of 118 thousand dollars, as well as overlapping the fibonacci extension levels as the target level. Volume increase in the short term and permanent daily candle closures over 112 thousand 500 dollars will be the clearest signals that support the upward scenario.
If the support is broken down, the target is 98 thousand dollars
On the other hand, Brandt will indicate that the three -day closing bulls have lost control under the support zone pointed out. According to the analyst, such a break is fake Bear Flag FormationIt will turn NU into a real decline formation, and then the $ 100,000 threshold, which is psychologically important, can be tested. This level is also followed as the first stop because it intersects with the bottom formations recorded in June.
The 98 thousand dollars threshold, which is seen as the next support zone, is considered as a critical threshold because the 50 -day mobile average is the point where the volume weighted average coincides. In case of sales pressure increases, leverage cleaning may be seen in futures transactions, which may lead to a short -term hard but limited decrease. However, analysts believe that in such a decrease, corporate purchases will be re -activated around 100 thousand dollars and the long -term rise trend structure will not deteriorate.
Responsibility Rejection: The information contained in this article does not contain investment advice. Investors should be aware that crypto currencies carry high volatility and thus risk and carry out their operations in line with their own research.