


The crypto industry has regained its lost momentum as the market has recorded a notable run this year. Top cryptocurrencies have repeatedly recorded new yearly highs, highlighting a rising adoption in the crypto space.
Further, AI tokens have gained significant attention as two of these tokens have successfully secured a spot in the top 5 gainers of the crypto industry this year. Injective has recorded a gain of over 1,200%, with Render token adding 780% to their respective portfolios.
Render Token Price Analysis:
The RNDR price traded in a consolidated range between $2.125 and $2.617 for the first half of November, following which the bulls regained momentum, and the price broke out of the range. The price recorded a jump of 60% in value within two days, after which the price faced rejection at $3.40.
Following this, the price traded between $3.150 and $3.40 for a while. During this time, the RNDR token experienced significant volatility in its value. The Render price, after multiple attempts, successfully broke out of the range and recorded a gain of 18%.
Recently, the price faced rejection at $4.029, following which the price has recorded a correction of over 6%. Positively, the 50-day EMA acts as a dynamic support, indicating a possibility of a trend reversal.
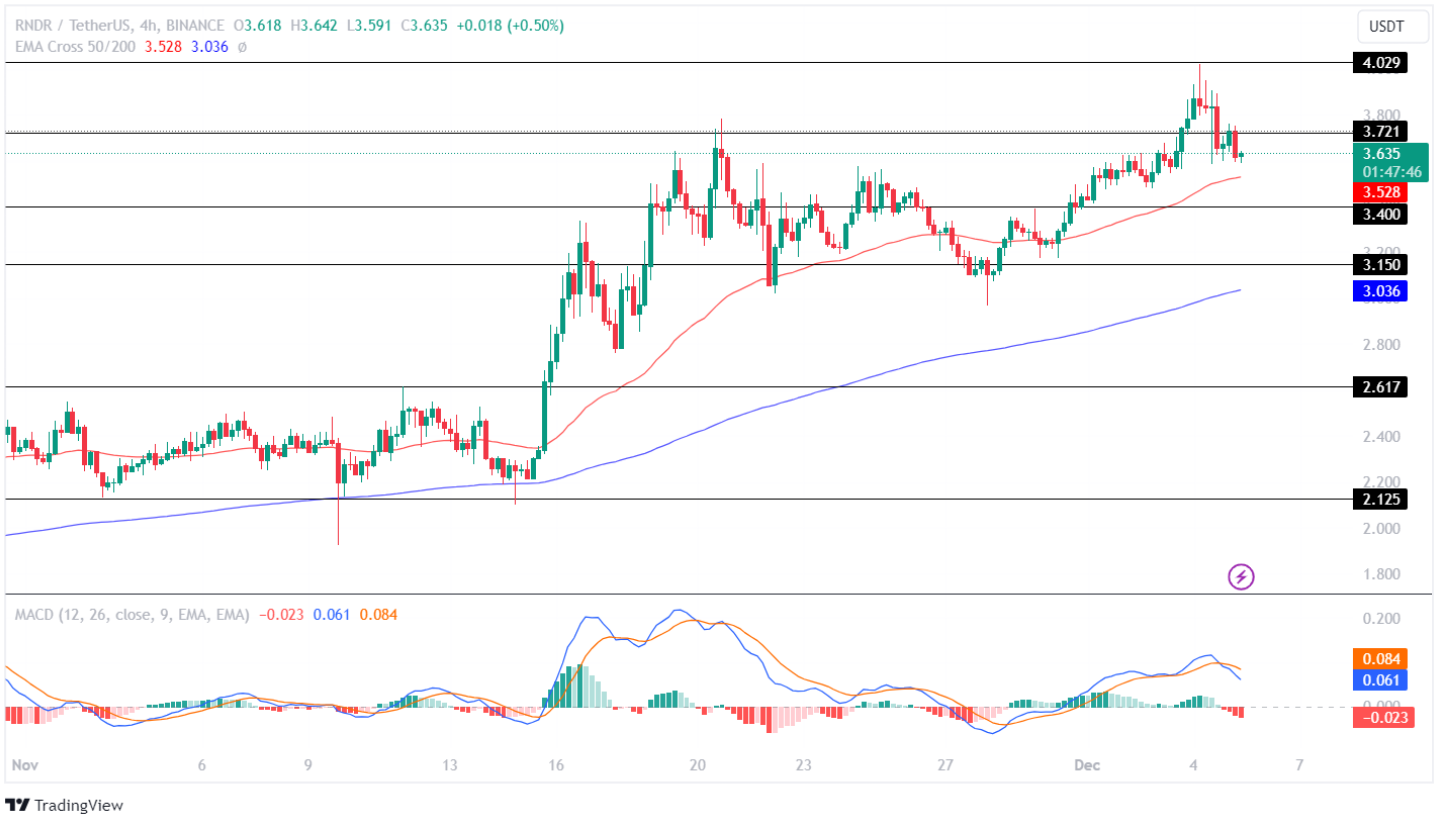
The MACD displays a rising red histogram, indicating a bearish influence over the price. Further, the averages show a bearish convergence, suggesting the price will continue experiencing a correction in value.
If the bulls push the price above the resistance level of $3.721, the RNDR price will regain momentum and prepare to test its upper resistance level of $4.029. Conversely, if the bulls fail to hold the price above the support level of $3.40, the price will continue losing value and test its low of $3.150 soon.
Injective Price Analysis:
November started positively as the INJ price recorded a gain of over 18% within the first two days. The price faced rejection at $15, following which it experienced a minor short in value. After multiple attempts, the price successfully broke out of the upper level and displayed a jump of approximately 20%.
The injective price then faced rejection at $17.913, following which the bulls made multiple attempts to break out. The market gained momentum and the bulls successfully broke out but hovered close to their resistance level for a while, after which the bulls lost momentum.
Since then, the price has been trading in a consolidated range between $15 and $17.913. The price has displayed significant price volatility during this time.
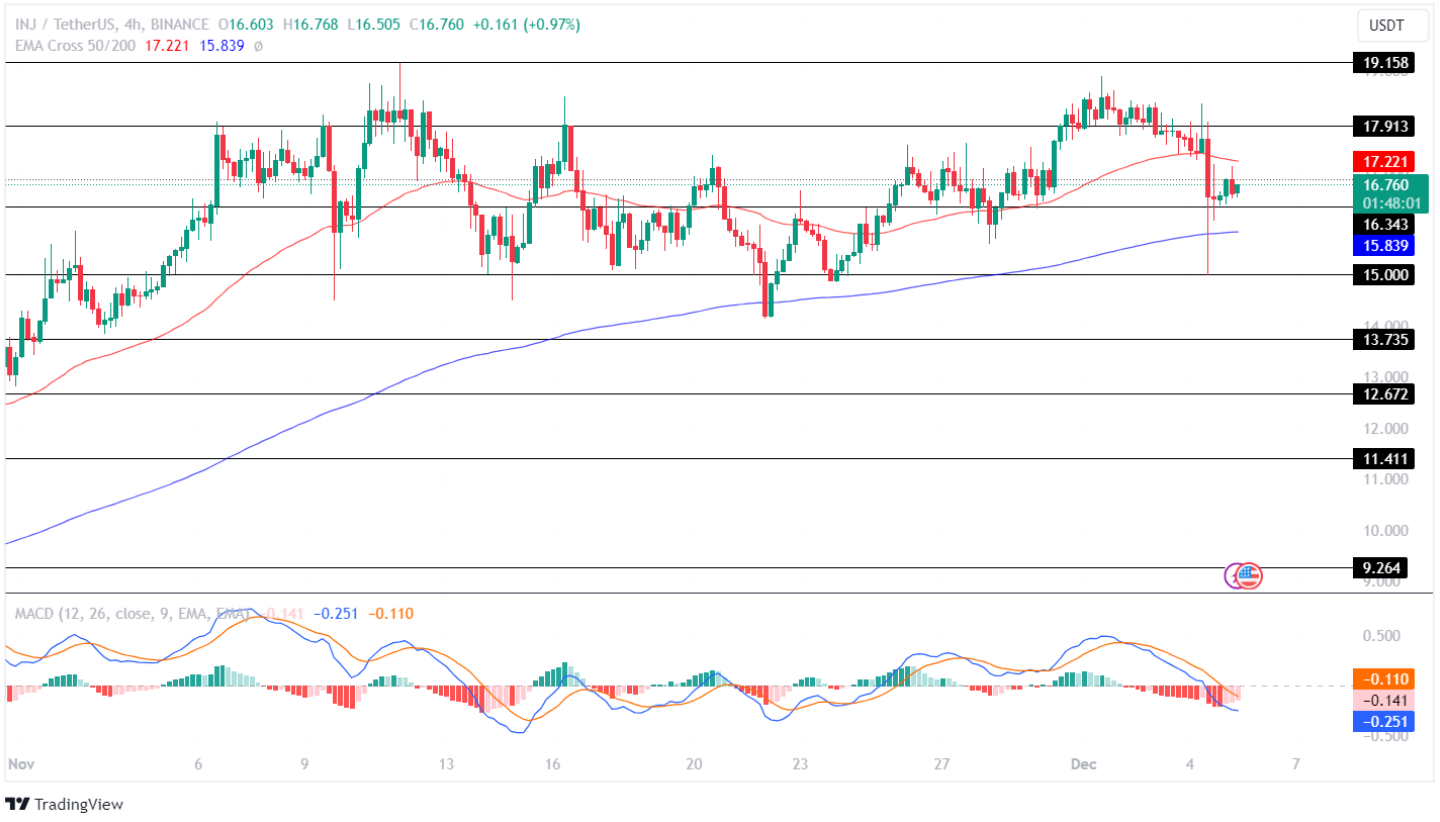
The Moving Average Convergence Divergence (MACD) displays a constant red histogram, indicating an increasing selling-over-buying pressure in the market. Further, the averages show a constant fall, suggesting the price will continue undergoing a correction in value.
If the bulls hold the price above the support level of $16.343, it will regain momentum and prepare to test its resistance level of $17.913 soon. Conversely, if the bears overpower the bulls, the price will continue to fall and test its lower support level of $15 in the coming days.
Oasis Network Price Analysis:
The Oasis Network started trading in November with a neutral trend. As the market gained momentum, the ROSE price broke out of the range and displayed a jump of 20%. Following this, the price experienced minor volatility.
The ROSE price regained momentum and displayed another jump of 20% in value before facing rejection at $0.070. The price then traded sideways between $0.06491 and $0.07702 for almost three weeks. Following this, the price broke out of the range, but the rally was short-lived as the price was restricted at $0.08306.
After multiple attempts, the price successfully broke out of the upper level but traded in a narrow space between $0.08306 and $0.08910 for a while. Recently, the price lost momentum and experienced a breakdown.
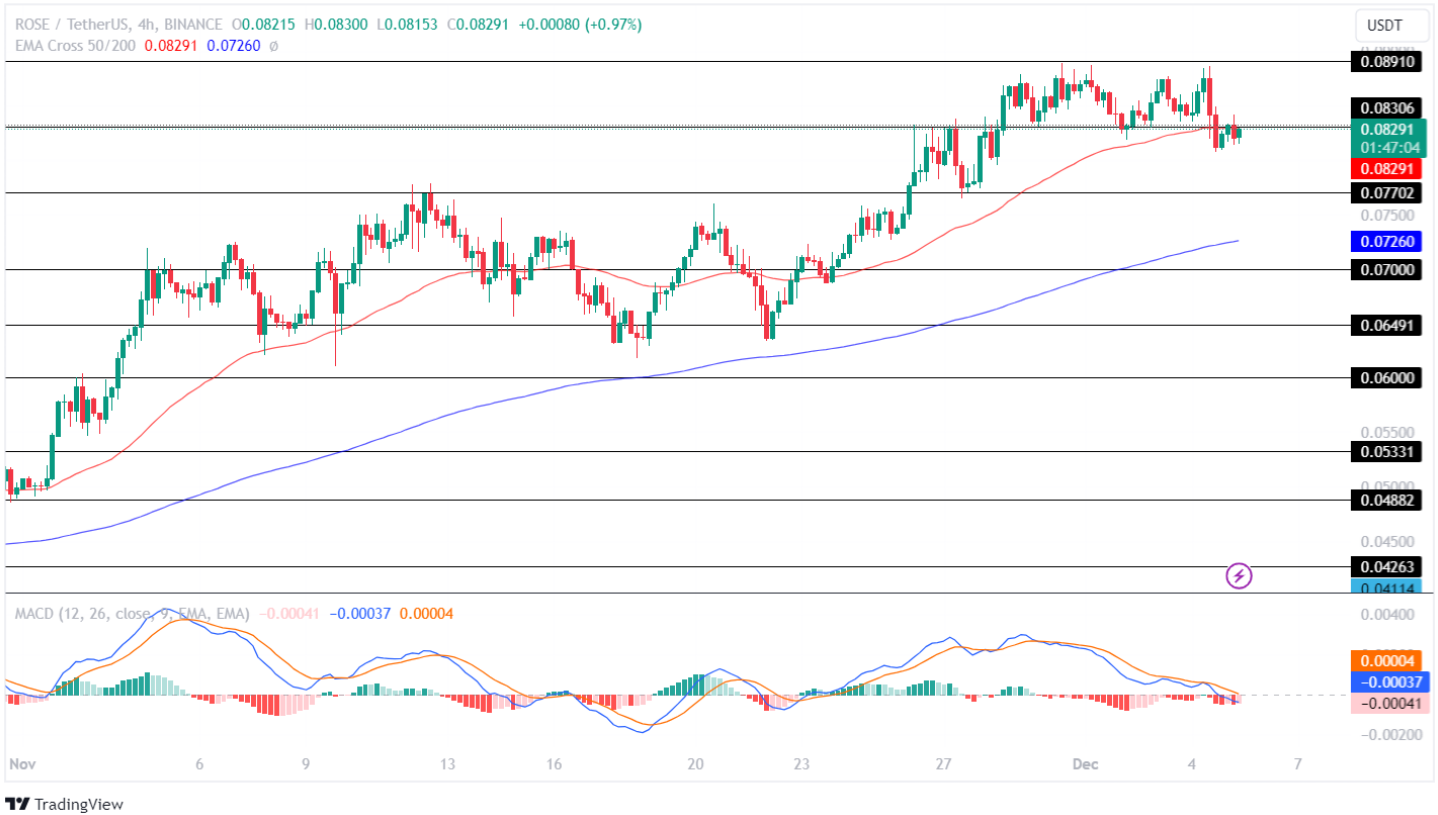
The technical indicator, MACD, displays a constant red histogram since the month started, indicating a strong bear power. Further, the averages show a constant fall, suggesting the price may experience a correction in the coming time.
If the bulls hold the price above the level of $0.08306, the price will regain momentum and test its upper level of $0.08910 soon. Conversely, if the bears overpower the bulls, the price will lose momentum and test its lower support level of $0.07702 in the coming days.
Conclusion:
The AI tokens displayed a notable run during the first half of the year as major tokens recorded gains of over 200% in their respective value. The AI category has immune potential and is still in an early stage of development.
Thus, this gives investors a potential chance to be early investors as these tokens have the potential to record massive jumps in their value in the coming time.
