
Table of contents
The U.S. spot XRP ETF market is entering a more consequential phase. After months in which activity appeared relatively contained, the market began showing signs of a much stronger institutional trading cycle through August and into September.
The important shift is not simply that ETF volumes increased. Trading activity, investor flows, XRP’s price action and broader institutional participation began moving together, creating a much different market structure from the quieter periods that preceded it. The acceleration also came as XRP itself faced a period of sharp price movements, making it harder to separate genuine demand for ETF exposure from activity driven by volatility.
That momentum has now been tested by a very different set of forces. The Senate’s failure to advance the CLARITY Act introduced fresh regulatory uncertainty around the U.S. crypto market, while the Federal Reserve’s September rate decision added a new macroeconomic variable just one day later. ETF flows subsequently weakened, putting the market’s earlier strength under a more immediate test.
This makes September more important than simply another month of ETF data. The central question is whether the surge seen through August and early September represents the beginning of a sustained expansion in institutional XRP exposure, or whether much of the activity was amplified by a temporary combination of price momentum, regulatory expectations and market volatility.

The following analysis examines that shift through ETF trading volumes, net flows, institutional holdings, XRP price action, whale activity and the regulatory and monetary-policy developments that have shaped the market.
1. August Changed the ETF Market
August marked the clearest acceleration in XRP ETF activity since the products launched. The seven U.S. spot XRP ETFs generated approximately $723 million in trading volume during August, establishing a monthly record. The increase was not limited to one session. ETF activity repeatedly moved above the $100 million level as XRP experienced a sharp price rebound during the month.
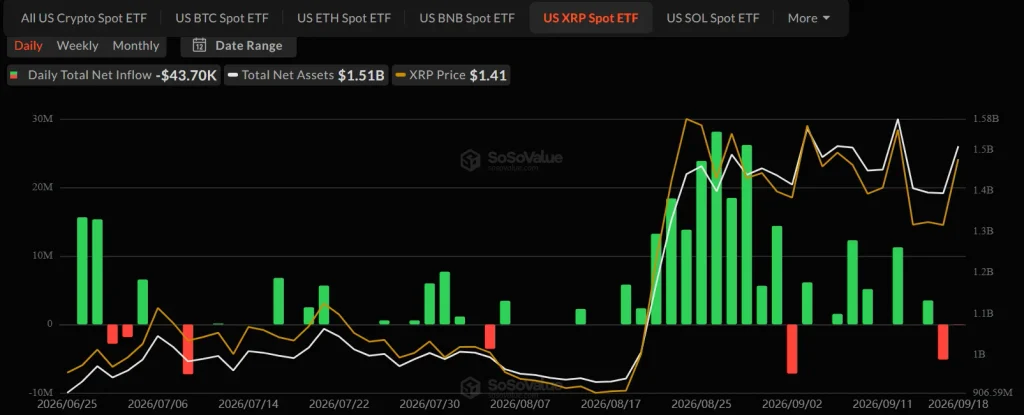
The Crypto Basic reported the $723 million monthly volume record on August 28, while separate reporting highlighted a record trading session on August 20.
This matters because trading volume and capital flows measure different things. As high trading volume indicates greater activity in the ETF market, but it does not mean an equivalent amount of new capital entered the funds.
Meanwhile, Net inflows measure creations minus redemptions and therefore provide a separate indication of capital movement. The month August delivered strength on both fronts: trading activity increased sharply, while ETF inflows also accelerated.
2. ETF Volume Races Toward $6B
The cumulative spot XRP ETF volume series subsequently accelerated from approximately $4.57 billion in August to $5.81 billion by the latest September reading.
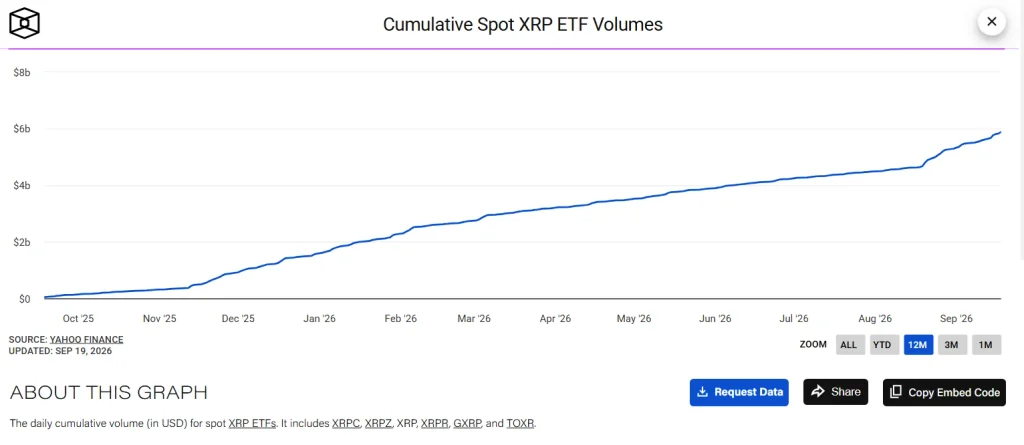
That represents an increase of roughly $1.24 billion in cumulative trading volume over approximately one month. Every purchase and sale of ETF shares contributes to trading volume, meaning the cumulative figure can rise substantially even when net inflows are comparatively smaller.
That distinction becomes particularly important when comparing the approximately $5.81 billion cumulative volume figure with approximately $1.7 billion of cumulative net inflows. The two numbers describe different parts of the market.
The volume expansion nevertheless shows that XRP ETFs entered a much more active trading regime during August and September than the quieter period earlier in 2026.
3. Early September Flows Stayed Positive
The improvement in ETF activity continued into September before the market’s regulatory and macro shocks. Spot XRP ETFs recorded approximately $18.98 million in net inflows during the week of September 7–11.
On September 14, the products added another $11.255 million, with Bitwise accounting for the reported daily inflow. That extended the strong flow pattern established during late August.
The previous week was already a major improvement over the first half of the year, although September’s weekly inflows were below the approximately $110 million weekly record reported for the final week of August.
This progression is important because it shows that August was not simply one isolated trading-volume spike. Net capital continued entering the funds into September. The pace subsequently weakened after the CLARITY Act vote and the Federal Reserve decision.
4. Cumulative Inflows Reaches $1.71B
By September 17, cumulative net inflows into U.S. spot XRP ETFs had reached approximately $1.71 billion, while reported net assets stood around $1.39 billion.
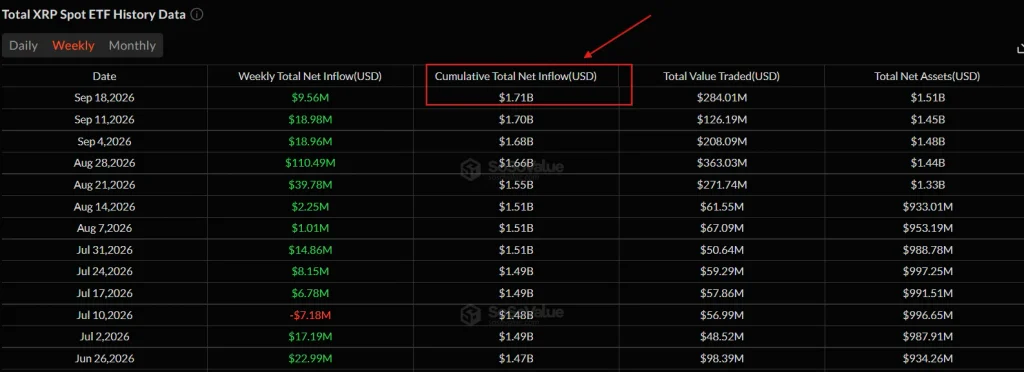
The difference between cumulative inflows and current net assets does not automatically represent investor withdrawals.
ETF net assets fluctuate with the market value of the underlying XRP. If XRP’s price falls, the dollar value of existing holdings can decline even when investors have not redeemed their ETF shares.
This distinction became particularly relevant during September because XRP experienced substantial price volatility.
The $1.71 billion figure therefore represents cumulative net capital flows, while the approximately $1.39 billion figure represents the current value of the ETF assets at the relevant measurement point.
5. About 1.1B XRP Represented by ETF Holdings
The dollar-based flow figures tell only part of the story. Another Separate XRP ETF tracking data placed combined XRP represented by the U.S. spot funds at approximately 1.1 billion XRP in September. That is a token-count measurement rather than a dollar-flow measurement.
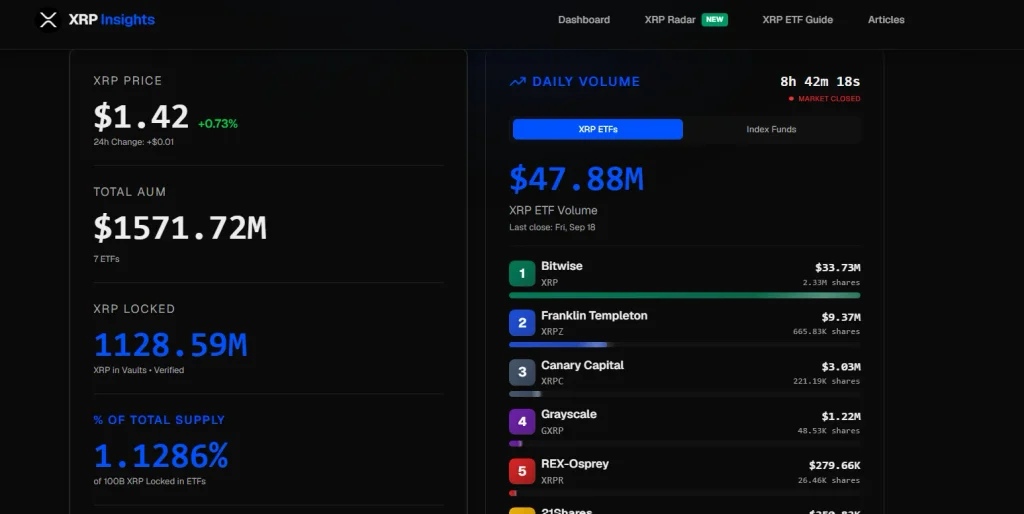
It also should not be described as 1.1 billion XRP permanently removed from the market. ETF holdings can change through creations, redemptions and changes in fund positions.
The significance is that the regulated U.S. ETF market now represents exposure to a substantial XRP balance. This gives the market another metric to monitor alongside cumulative inflows, net assets and trading volume.
6. Wall Street’s XRP ETF Exposure
Institutional disclosures added another layer to the ETF story. Goldman Sachs reported approximately $87.4 million of XRP ETF exposure at the end of Q2 2026, according to reporting based on its 13F filing.
Jane Street reported approximately $16.6 million, while Millennium Management reported roughly $16.2 million.
The broader Bloomberg Intelligence holder compilation placed identified institutional XRP ETF exposure at approximately $183.5 million.
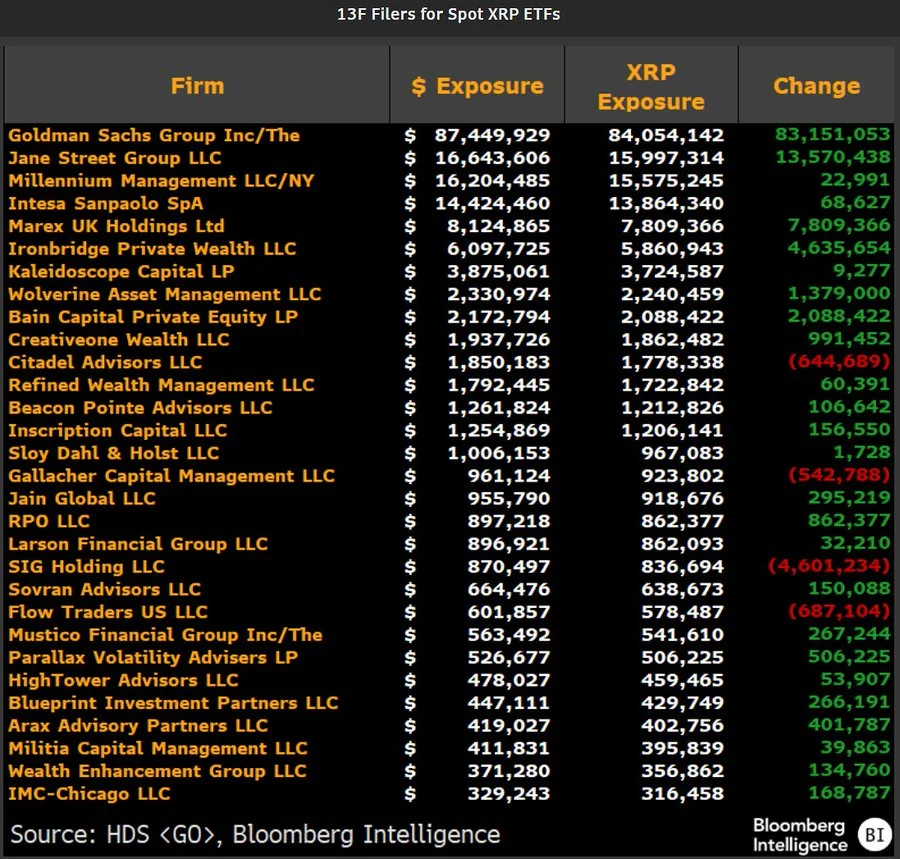
The Goldman position is particularly notable because the bank had previously reported a substantially larger XRP ETF position at the end of 2025 before reporting no position in Q1 2026.
However, a 13F identifies reportable securities held at quarter-end. It does not reveal whether a position was directional, hedged, related to market making or connected to client activity. The filings therefore establish institutional ownership, but not the investment strategy behind every position.
7. September 15: CLARITY Act Vote Fails
The regulatory backdrop changed sharply on September 15. The U.S. Senate failed to advance the Digital Asset Market CLARITY Act after a procedural vote fell short of the 60 votes required to invoke cloture.
The recorded result was 49–50, according to CoinDesk’s reporting on the Senate vote. The legislation was intended to establish a broader federal market-structure framework for digital assets, including clearer regulatory responsibilities for the SEC and CFTC.
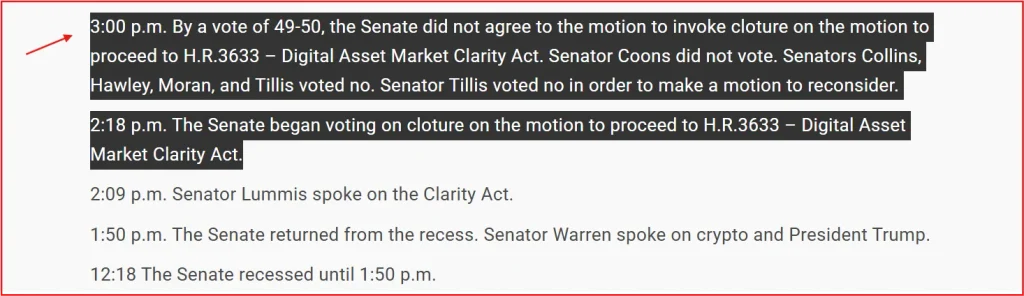
The vote was not a final vote on the substantive provisions of the legislation. It was a procedural vote on advancing the bill. That distinction truly matters when describing this event.
8. XRP Drops After the Senate Setback
The CLARITY Act vote immediately became a market catalyst. CoinDesk reported that XRP fell roughly 10%, with the token moving toward the $1.30 area as the broader cryptocurrency market also declined. The move demonstrated how strongly regulatory expectations had become connected to XRP trading conditions.
However, the Senate vote did not change XRP’s existing supply, blockchain infrastructure or ETF structure overnight. What changed was the market’s assessment of the regulatory path surrounding the U.S. digital-asset industry.
Therefore, the Spot XRP ETFs continued operating after the vote. The event instead changed the external environment in which those funds were trading.
9. September 16: FED Raises Rates
The following day brought a second major market catalyst. On September 16, the Federal Reserve raised the federal-funds target range by 25 basis points to 3.75%–4.00%.
The move was the Fed’s first rate increase since 2023. The central bank said economic activity was expanding at a solid pace, while inflation remained elevated.
The September projections placed the median federal-funds rate at 4.1% at the end of 2026. That created a very different macro backdrop from the one investors might have expected from a straightforward easing cycle.
For XRP and other risk assets, the Fed decision matters through broader financial conditions, liquidity expectations and the relative attractiveness of interest-bearing assets.
But the September 16 market reaction also needs to be viewed alongside the CLARITY Act failure one day earlier. The two events occurred almost back-to-back.
10. ETF Flows Turn Negative on SEPT. 17
The ETF market eventually reflected the volatility. On September 17, U.S. spot XRP ETFs recorded approximately $5.15 million in net outflows, according to SoSoValue data reported by CoinDesk and Benzinga.
Canary Capital’s XRPC recorded an estimated $1.37 million outflow, while 21Shares’ TOXR accounted for approximately $3.78 million.
Despite the daily outflow, the broader weekly balance remained positive at that point. That is an important distinction.
The September 17 figure shows that ETF demand weakened during the regulatory and macro shock. It does not establish that the broader ETF trend had reversed.
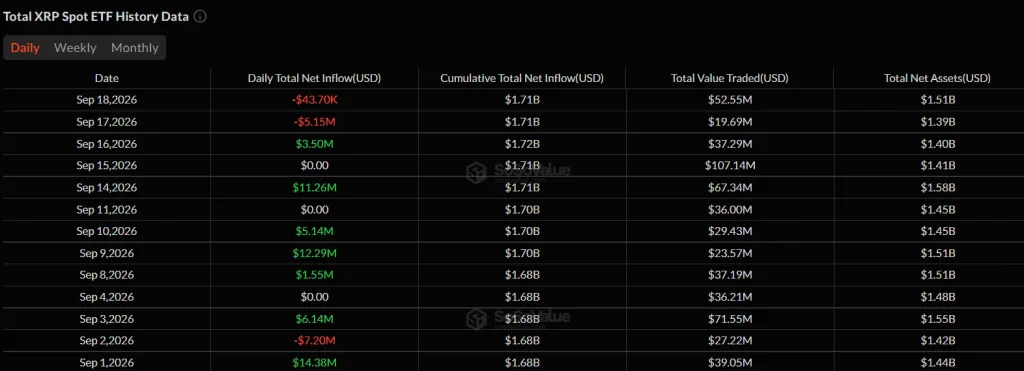
A single negative session is also small relative to the approximately $1.71 billion of cumulative net inflows accumulated by the funds.
11. The August Price Rally Amplified Activity
ETF activity coincided with a major XRP price recovery in August. XRP traded below $1 during the August 18 low before recovering sharply. The token subsequently moved toward approximately $1.70 during the later August rally before correcting.
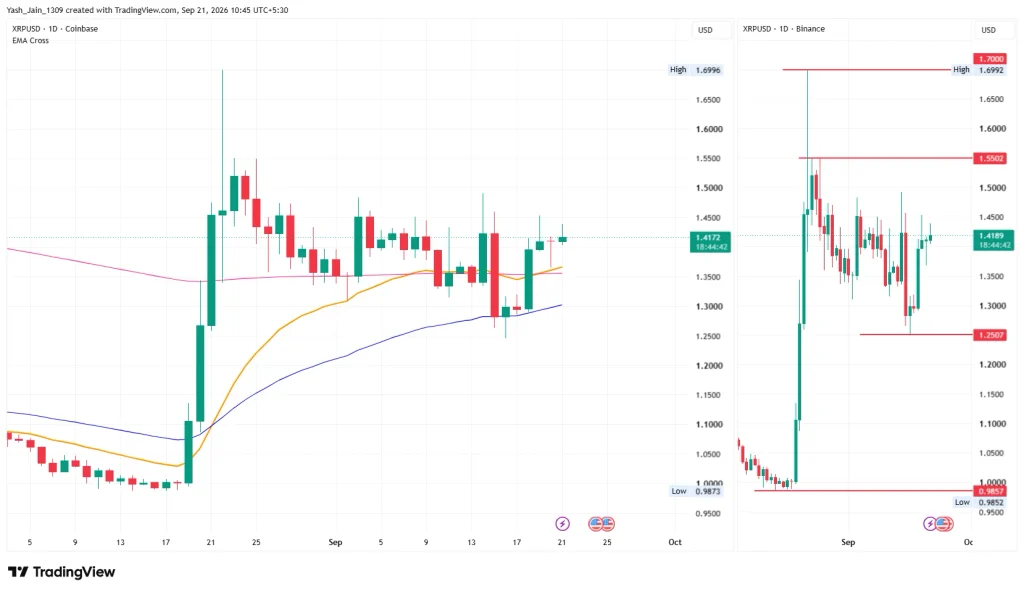
That price movement helped create an environment in which both ETF trading volume and investor attention increased. The relationship should not be treated as one-way causation.
Higher XRP prices can increase ETF dollar trading volume even when the number of shares traded remains unchanged. At the same time, increased ETF participation can contribute to broader market liquidity.
The August data therefore show a simultaneous increase in price, trading activity and ETF flows rather than proving that one caused the others.
12. Whale Activity Adds Another Data Point
On-chain activity also increased during the August XRP move. Reporting based on CryptoQuant and Santiment data highlighted changes in large XRP-holder activity and exchange flows during the rally.
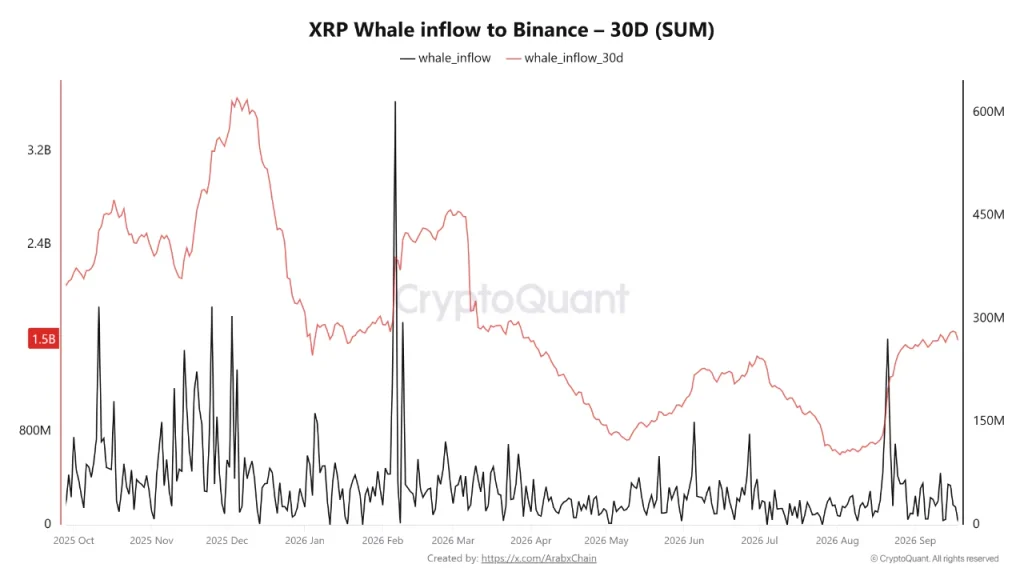
However, these metrics need to be kept separate from ETF data. A large-wallet transfer does not necessarily represent buying or selling. Tokens can move between wallets, custodians and exchanges for operational reasons.
Likewise, exchange inflows and outflows can indicate changes in available exchange balances without identifying the ultimate owner or intent of the transfer.
The on-chain data are therefore useful as a complementary market signal, but they should not be used to convert ETF activity into a definitive institutional accumulation figure.
13. ETF Activity Now has Three Core Metrics
The XRP ETF market can now be tracked through three separate numbers:
| Metric | Latest reported level |
| Cumulative spot ETF trading volume | approx. $5.81B |
| Cumulative net inflows | approx. $1.71B |
| XRP represented by ETF holdings | approx. 1.1B XRP |
These figures should never be treated as interchangeable. Trading volume measures shares changing hands. Net inflows measure capital entering the funds after redemptions. XRP holdings measure the underlying token exposure represented by the ETFs.
Moreover, a fourth number is ‘net assets’ that changes with both flows and XRP’s market price. That framework makes the September market easier to read. The ETF market experienced a genuine expansion in trading activity and cumulative flows, but neither metric alone establishes the investment motive of every participant.
14. September Has become the Real Test
The August breakout established a new activity level for the XRP ETF market. September has now tested whether that activity can continue through a more difficult external environment.
The market absorbed a failed CLARITY Act procedural vote on September 15, a Federal Reserve rate increase on September 16 and a $5.15 million ETF outflow on September 17.
At the same time, cumulative XRP ETF inflows remained around $1.71 billion, while cumulative trading volume approached $6 billion.
That leaves a much clearer framework for monitoring the market from here. The most important figures are no longer simply daily trading-volume records.
The next data points to watch are weekly net inflows, ETF-held XRP, total ETF assets and institutional holdings in subsequent 13F filings.
If those metrics remain elevated while volatility increases, the market structure will look materially different from the quieter conditions seen earlier in 2026.
XRP ETF Reports Final Takeaway
The XRP ETF market has moved beyond its launch phase. Approximately $5.81 billion of cumulative trading volume, roughly $1.71 billion of cumulative net inflows and around 1.1 billion XRP represented by the spot funds show how much larger the regulated XRP investment channel has become.
August was the major acceleration point. But, early September extended that momentum. September 15–17 then introduced the first major regulatory and macro stress test, with the CLARITY Act failing to advance, the Federal Reserve raising rates and ETF flows turning negative for one session.
The latest data therefore point to an active XRP ETF market, but not a one-directional market. The next stage will be defined by whether the elevated volume and cumulative inflow base remain intact after the regulatory and monetary-policy shocks that reshaped the market in mid-September.