Hedera’s HBAR token has started to attract the attention of analysts with the significant upward moves seen on its chart recently. Especially the activity on the weekly chart shows that the price is trying to break out of the long-term downward trend. Analyst CRYPFLOW highlighted a reversal signal, which he described as a “double breakout” in both the price structure and the RSI indicator. According to these comments, HBAR is in the process of breaking out of the squeeze that has been going on for months.
Reversal sign on technical indicators
According to CRYPFLOW, HBAR’s weekly chart falls into a three-phase structure typically seen during major cycle reversals. These phases are listed as first a compression of the current downtrend, then a break in the price structure, and finally a bullish expansion on the candlestick charts. The analyst noted that it is important that the recent price action moves both price and momentum upward together; Because supporting the breakouts that occur over large time frames with momentum indicators means that the outflows may be more permanent.
The analyst also stated that in the short term, there may be a possible negative cross in the stochastic RSI and this may slow down the upward movement. However, it was underlined that this development does not completely invalidate the general rise structure and can only be considered as a short-term period of gathering power.
CRYPFLOW evaluated, “The simultaneous change in price and momentum is critical for investors taking positions in higher time frames.”
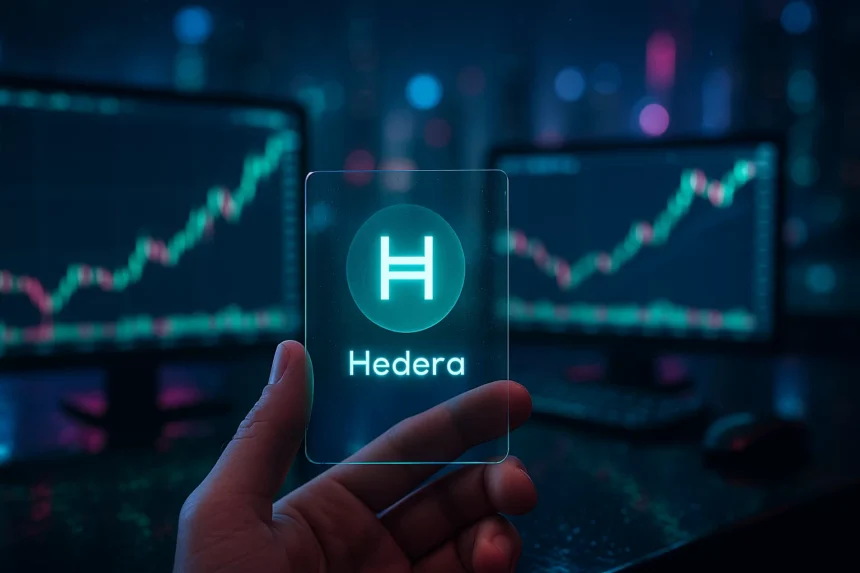
HBAR price is close to $0.10
According to market data, Hedera was traded at $0.09678 at the time of writing. In the last 24-hour band, the lowest price range was recorded at $0.09231 and the highest at $0.09944. While HBAR’s total market value was 4.20 billion dollars, its transaction volume reached 116.87 million dollars in the last day. The total supply in circulation is 43.37 billion units and with this data it ranked 37th on the platform. CryptoAppsy According to data, HBAR is currently traded at $ 0.09678.
The current price of the token is well below the historical high of $0.57 recorded on September 15, 2021. At the current level, HBAR is still 82.98 percent behind this record. Looking at the latest price movement, buyers are trying to turn the $0.09 region into a solid base. If the price breaks above $0.10 soon, the reversal structure on the weekly chart is likely to attract broader investor interest.
Short-term movements and market evaluations
The analyst nicknamed Scient stated that the price movement took on a positive outlook as HBAR broke an important control level upwards in the short term. According to the analyst, HBAR crossed the top of a short-term mini range and managed to break out of the price structure that has been horizontal for a while. While the upward target box is shown on the chart, it was stated that position changes regarding the price testing the upper limit of the range again will be monitored.
This approach also aligns with CRYPFLOW’s longer-term analysis. On the one hand, the expectation of expansion in the macro structure comes to the fore, on the other hand, it is emphasized that the short-term mini-break may support the first phase of the rise.
Finally, ALLINCRYPTO drew attention to the ongoing stablecoin standards debate in the crypto market and stated that LINK, XRP and QNT tokens, along with Hedera, came to the fore in evaluations related to the Bank of England. However, the main focus for HBAR for now is on whether the upward movement indicated by technical indicators will be permanent.