
Bitcoin is attempting to stabilize after a sharp liquidation-driven wick that briefly pushed the price toward the $60K region earlier this month. The daily structure still remains uncertain, but early signs of momentum stabilization are emerging as BTC price trades near $65,600, up roughly 2.4% over the past 24 hours.
However, the broader trend still reflects a series of lower highs and lower lows. Bulls have not reclaimed structural resistance yet. The real test lies ahead near the $70K–$72K supply zone.
Why Bitcoin Price Is Stabilizing Now
The recent bounce appears to be a reaction from a well-defined demand zone between $61K and $63K. This area absorbed heavy selling pressure and triggered short covering. Derivatives positioning has cooled, and funding rates are hovering near neutral to slightly positive. No extreme long imbalance is visible, and the open interest is stabilising after the earlier flush.
This suggests forced liquidation has already occurred. But stabilization is not reversal.
Technical Structure: Key Levels to Watch
| Level | Significance |
| $72,000 | Major supply zone |
| $70,000 | Immediate resistance |
| $66,500 | Minor breakout trigger |
| $63,000 | Range midpoint |
| $61,000 to $62,000 | Strong demand zone |
| $58,000 | Breakdown acceleration level |
RSI and Momentum Outlook
Bitcoin is currently trapped mid-range between a crucial resistance and support zone. The latest rebound from the support range between $62,000 and $63,000 has attracted some liquidity. However, the bulls have failed to secure $65,600, which raises some concerns as the resistance zone between $70,400 and $71,500 currently remains out of reach. A decisive move is required to define direction.
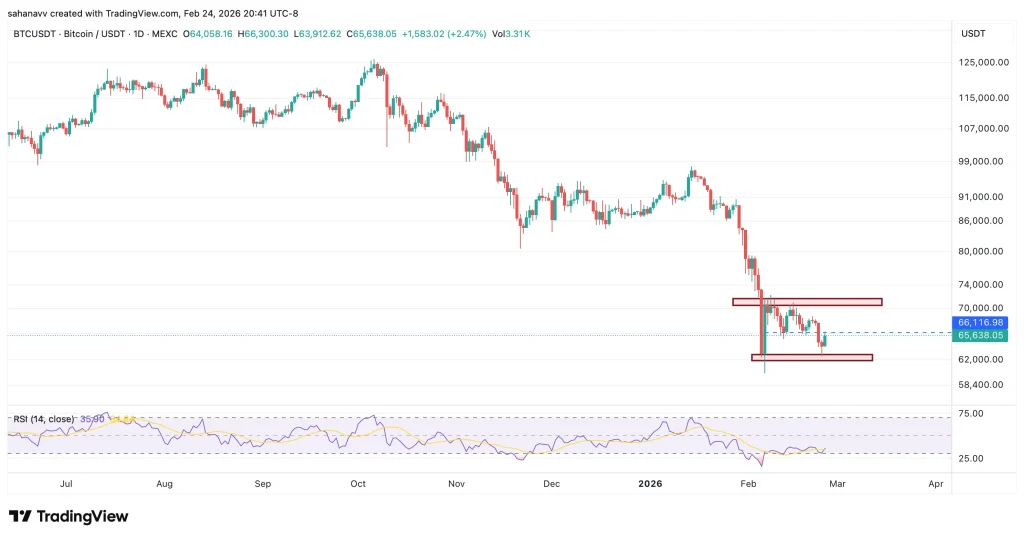
The daily RSI is hovering near the 35–40 region after previously dipping close to oversold territory. While momentum is curling upward, RSI remains below 50. That keeps broader trend bias bearish.
For a sustained recovery attempt, RSI must reclaim 50, and the BTC price must close above $67K on strong volume. Until then, rallies remain vulnerable.
Derivatives Insight: Positioning Is Neutral
The Open Interest witnessed a major pullback since the start of the month, but soon after reaching the lower range, the levels froze between $40 billion and $45 billion, preventing further drop. On the other hand, the funding rates have turned slightly positive in the past few hours, keeping the bullish hopes alive.

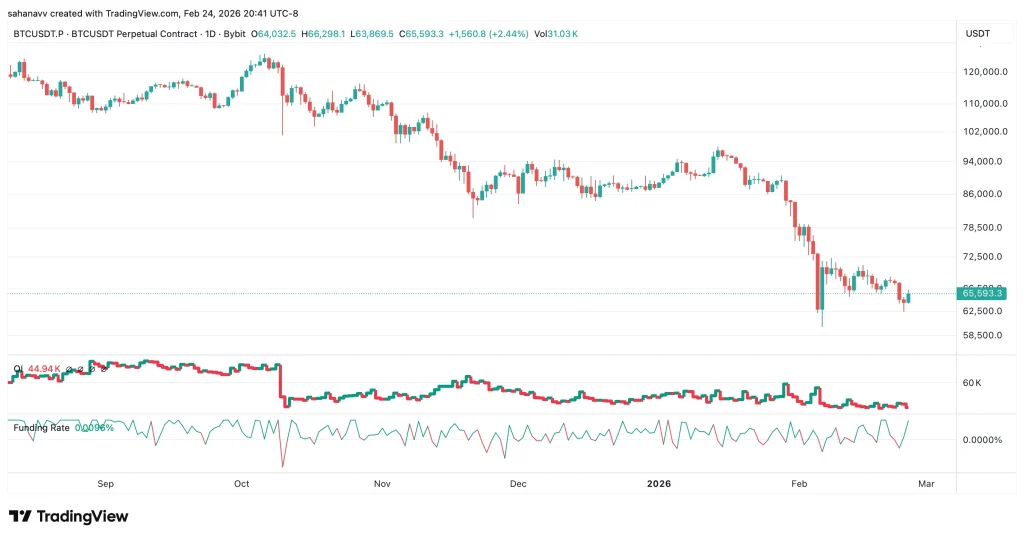
Funding rate currently sits slightly positive, indicating no aggressive long buildup. This reduces immediate squeeze risk but also shows a lack of strong bullish conviction. If open interest expands alongside a breakout above $67K, momentum could accelerate toward the supply cluster near $70K–$72K. If OI rises while price stalls, that increases breakdown probability.
Here’s What to Watch Next: Two Scenarios Ahead
Bullish Scenario: If the BTC price reclaims $66,500 convincingly and secures a daily close above $67,000, then upside targets emerge:
- $70,000 initial resistance
- $72,000 major supply
- Break above $72,000 opens a path toward $78K and potentially $86,000.
However, momentum confirmation is required with the RSI rising above 50.
Bearish Scenario: If the BTC price loses the $61,000 support, which is the critical one, then downside risk accelerates toward,
- $58,000 liquidity pocket
- Below $58K opens macro demand near $52,000
- An extended breakdown may test $48,000
In the meantime, the bears have begun to offer a strong upward pressure; therefore, it would be interesting to watch how things will unfold hereafter. Whether the Bitcoin (BTC) price secures a daily close within the bullish range or slips back to the bearish range is the prime focus right now!.
FAQs
Bitcoin is bouncing due to a strong demand zone between $61K and $63K absorbing recent sell pressure, triggering short covering and stabilizing funding rates.
The market is at a critical decision point. A daily close above $67,000 could lead to a rally toward $70K, while losing the $61,000 support may accelerate a drop toward $58,000.
The immediate resistance stands at $70,000, followed by the major supply zone between $71,500 and $72,000, which bulls must reclaim to confirm a trend reversal.
This week hinges on whether BTC holds above the $63,000 range midpoint. A move above $66,500 targets $70K, while a drop below $61K could lead to a test of the $58,000 liquidity zone.
Trust with CoinPedia:
CoinPedia has been delivering accurate and timely cryptocurrency and blockchain updates since 2017. All content is created by our expert panel of analysts and journalists, following strict Editorial Guidelines based on E-E-A-T (Experience, Expertise, Authoritativeness, Trustworthiness). Every article is fact-checked against reputable sources to ensure accuracy, transparency, and reliability. Our review policy guarantees unbiased evaluations when recommending exchanges, platforms, or tools. We strive to provide timely updates about everything crypto & blockchain, right from startups to industry majors.
Investment Disclaimer:
All opinions and insights shared represent the author’s own views on current market conditions. Please do your own research before making investment decisions. Neither the writer nor the publication assumes responsibility for your financial choices.
Sponsored and Advertisements:
Sponsored content and affiliate links may appear on our site. Advertisements are marked clearly, and our editorial content remains entirely independent from our ad partners.