CEO of Bitcoin Magazine David BaileyHe made a striking statement on his personal account on the social media platform X on January 21. Bailey, 47th US President Donald TrumpBitcoin (BTC) in ‘s top 200 decrees $107,955.4 and stated that there were decisions regarding the cryptocurrency market. Stating that this information is accurate, Bailey added that he did not know the details about the specific substances selected. The statement of the CEO of Bitcoin Magazine caused the excitement that decreased when cryptocurrencies were not included in the first day’s decrees to increase again.
“Cryptocurrencies are in Trump’s Executive Orders”
Bailey said in his social media post: “I received approval tonight, executive orders regarding us are among the top 200. “I don’t know what’s going on inside, but good news is coming soon,” he said. These decrees, which Trump signed immediately after taking office, are very important as they have the potential to affect the global financial system. Hence Bailey’s statement cryptocurrency increased the excitement in the world.
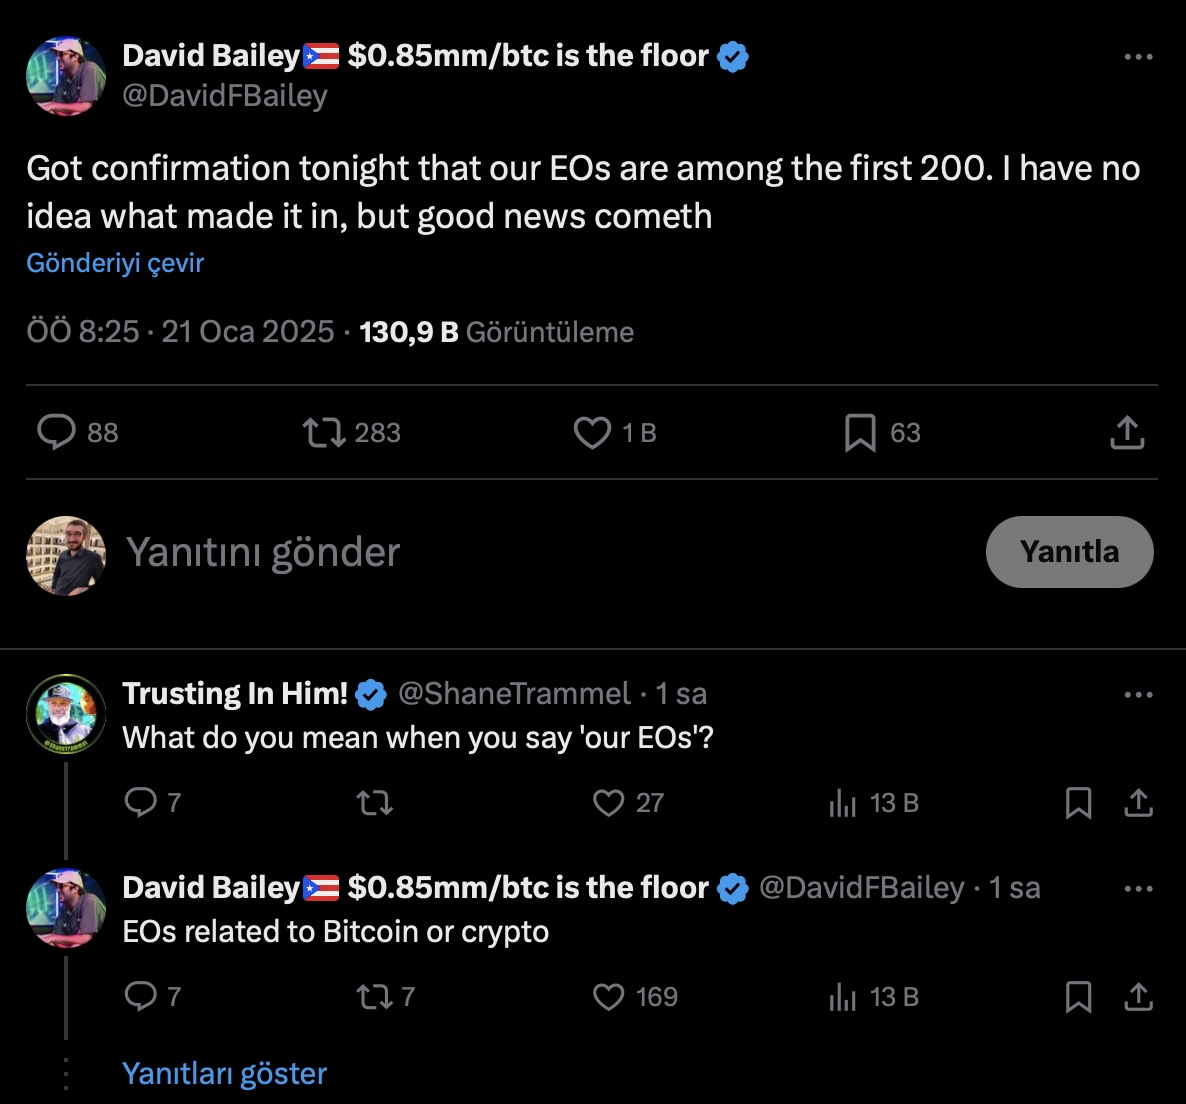
For those who don’t know, presidential decrees are directly put into practice with executive authority. It is thought that these decrees may bring important regulations to the cryptocurrency market. At this point, let us note that Bailey underlines that he does not have information about which decisions will come into force.
Expectations are High in the Cryptocurrency Market
in the USA Bitcoin and future regulations for altcoins are eagerly awaited by market participants. Decisions to be made cryptocurrency marketIt will have significant impacts on the general direction of the

Experts are of the opinion that the entry into force of even the decisions left over from the previous Trump period will positively affect the future of the cryptocurrency industry. It is considered that steps in this direction, especially from a country with a financial leadership position such as the USA, will have global effects.
As you may remember, the cryptocurrency market entered a serious recovery period in 2023 and 2024 after a sad year 2022. During this period, it was seen that Bitcoin, the largest cryptocurrency, rose particularly sharply. Now, a unique era is expected to begin with decrees involving cryptocurrencies.
Disclaimer: The information contained in this article does not constitute investment advice. Investors should be aware that cryptocurrencies carry high volatility and therefore risk, and should carry out their transactions in line with their own research.