
Polkadot (DOT) recent rally has cooled, but the market doesn’t appear concerned. After briefly pushing higher earlier this month, Polkadot price eased into a tight range near $2.10-$2.20, calming alongside a broader pause across altcoin markets. At first look, the sideways move looks unremarkable, but price structure tells a more interesting story beneath the surface.
The Polkadot price is holding ground and the reversal is still in shape, and the market participants which rushed during the breakout now appear to be watching rather than chasing. For Polkadot (DOT), the momentum cool-off is less about exhaustion and more about whether buyers are willing to stay once the excitement fades: And that question is now being answered on the price chart.
What Sparked the DOT Reversal Move
Polkadot (DOT) price reversal didn’t come out of nowhere. Earlier developments from two fronts, a Robinhood listing expanded retail access, while broader narratives around institutional exposure, including Grayscale-linked discussions, added credibility to DOT moving around the demand zone.
That combination pushed DOT out of a prolonged downtrend and a sharp reversal rally was noted in the early 2026. Since then, DOT has gained traction and shifted gears from reacting to headlines to evaluating whether breakout could extend further without constant catalysts.
What Polkadot (DOT) Price Chart Shows Right Now
Polkadot (DOT) price chart reflects a meaningful shift in structure followed by a controlled pause rather than losing momentum. After spending several weeks of downtrend inside a descending wedge pattern, DOT has broken the series of lower lows and shown a reversal.

Following a price reversal, DOT has started surging inside an ascending channel forming higher highs, that move carried DOT above the $2 level. Since the rebound from the demand zone of $1.80, DOT’s short-term moving averages flipped upwards and the momentum indicators also revealed a positive outlook.
As long as the DOT price holds above the $2 support zone, the bullish structure remains valid and a break above the $2.30 mark would open the doors toward $2.80 followed by $3.20 in the near term.
On-Chain Metrics Points to Bullish Outlook
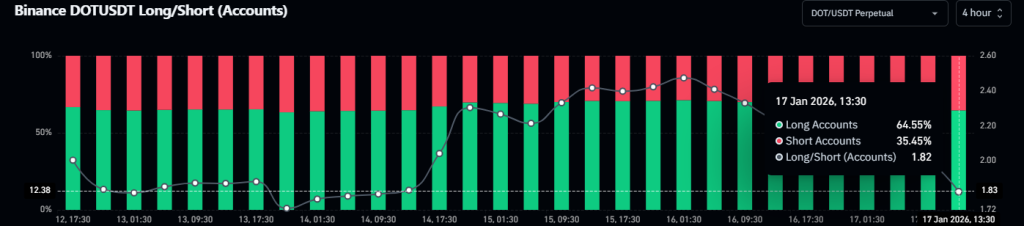
Data from Coinglass highlights that traders betting more on the long-side, compared to those taking the short-side. At press time, DOT’s Long/Short ratio noted at 1.82, outlining the bullish outlook. However, the major liquidation cluster stood at $2.28 where $786K worth of short positions exists.

Alongside the DOT’s price surge of over 3.20% , the Open Interest (OI) data showed a rise over 7.30% to $211.77 Million, revealing bullish positioning in the market.
Polkadot’s next move will be decided by levels, not headlines. As long as DOT remains inside the ascending channel above $2, the reversal is intact and a push beyond $2.50 would bring more strength. While if breaks below $2, short term consolidation may be seen ahead.
FAQs
Yes. DOT remains bullish as long as it holds above $2 and trades inside the ascending channel formed after breaking its downtrend.
In 2026, DOT price may trend higher if it holds above key supports and adoption improves, with $3–$5 acting as realistic bullish zones.
If Polkadot adoption grows steadily, DOT could trade significantly higher by 2030, but long-term value depends on network use and market cycles.
In five years, Polkadot could be a mature interoperability network, with DOT valued more on utility, staking demand, and ecosystem growth.
Trust with CoinPedia:
CoinPedia has been delivering accurate and timely cryptocurrency and blockchain updates since 2017. All content is created by our expert panel of analysts and journalists, following strict Editorial Guidelines based on E-E-A-T (Experience, Expertise, Authoritativeness, Trustworthiness). Every article is fact-checked against reputable sources to ensure accuracy, transparency, and reliability. Our review policy guarantees unbiased evaluations when recommending exchanges, platforms, or tools. We strive to provide timely updates about everything crypto & blockchain, right from startups to industry majors.
Investment Disclaimer:
All opinions and insights shared represent the author’s own views on current market conditions. Please do your own research before making investment decisions. Neither the writer nor the publication assumes responsibility for your financial choices.
Sponsored and Advertisements:
Sponsored content and affiliate links may appear on our site. Advertisements are marked clearly, and our editorial content remains entirely independent from our ad partners.