
After spending several weeks under pressure, Render (RENDER), the native token powering decentralized GPU has started to outperform as decentralized rendering drew real-word interest.
Following a range breakout above the $1.40 mark, RENDER price picked up pace and sharply uplifted over 30% within a week. This sharp price rally turned the $2 resistance mark into support and key EMAs flipped bullish.
As Render steadily holds the $2 mark, the price structure appears to be setting the stage for a potential breakout above the $3 resistance level.
Let’s dive into the market structure and on-chain cues that could tip the scales.
Render Price Structure Hints at a Potential Trend Shift
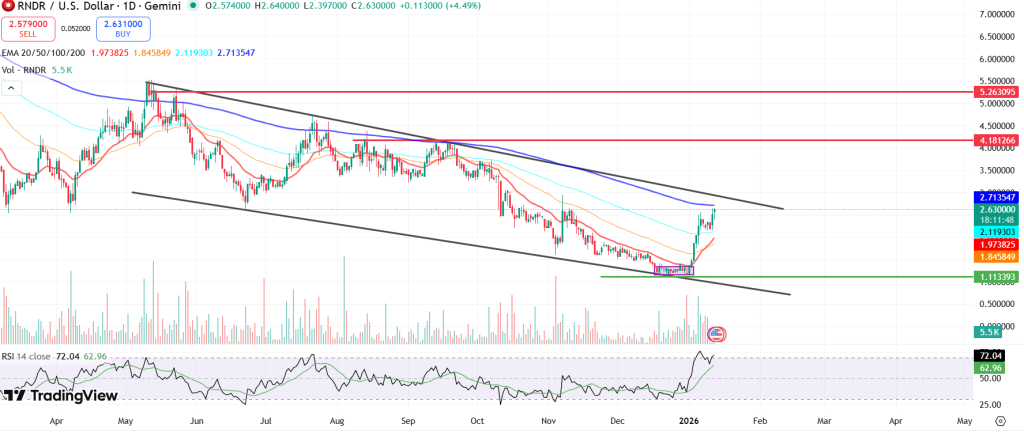
After months of drifting lower within the falling channel pattern, RNDR price has finally snapped its multi-month slide, reclaiming the $2 level.
This shift is more than just a bounce, as Render price surged past the 20,50 and 100 day EMAs, showcasing accumulation behaviour.
At press time, Render (RENDER) price traded at $2.57, noting an intraday rise of over 12%, making it a top performer among AI and Big Data coins.
Furthermore, Render price climbed over 60% in early 2026, signaling renewed buying interest and improved market sentiment.
RENDER price chart structure showcased a trend reversal, as bulls have gained traction and the token has started to form the higher-high and higher low structure.
Furthermore, the momentum indicators also favor the bullish thesis. The daily RSI has pushed above the neutral 50 mark and is heading toward the overbought region.
Furthermore, the Chaikin Money Flow (CMF) turned positive, replicating rising capital inflows into Render. Also, the On-Balance Volume (OBV) started ticking higher, implying gradual accumulation.
On-Chain Data Leans Bullish as Buyers Step In
On-chain data adds weight to the bullish thesis. Data from Coinglass shows that, Render liquidation heatmap posted an optimistic picture among the long and short positions taker.
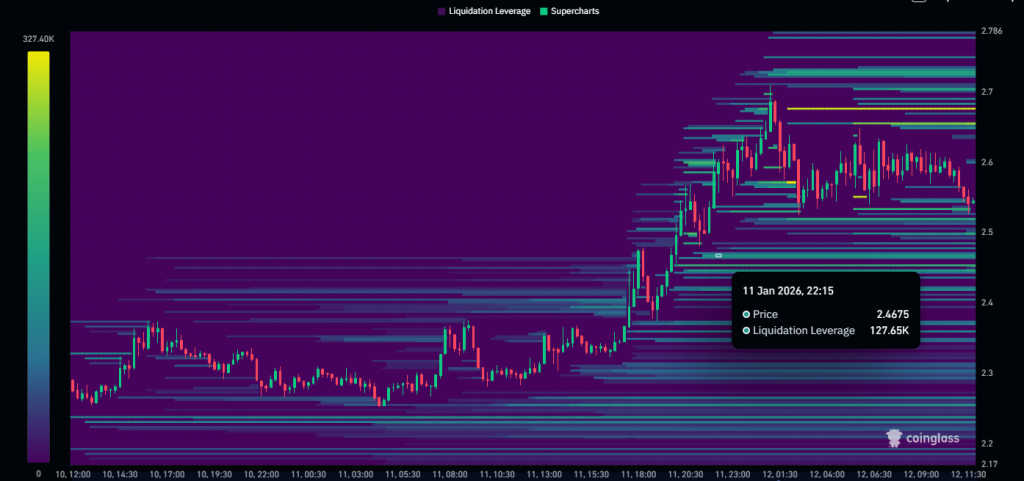

With 100k worth of positions liquidated around $2.40, the next liquidity pool was at around $3. This may fuel further upside ahead.
Furthermore, the Open Interest (OI) gradually increased this week. As of writing, posting a surge over 27% to $76.2 Million, reflecting increasing buyer interest.
What Must Happen for Bullish Continuation
For Render price to confirm a trend reversal, bulls must flip the $3 resistance level into support. A decisive close above this region would validate a channel breakout and could push RENDER price toward $4 followed by $5 levels.
Failure to hold above the $2 20 mark could force another consolidation phase and may retest the swing lows of $2 and $1.60 in the coming sessions.
Until a clean breakout, RENDER remains in a recovery to reversal transition phase.
Trust with CoinPedia:
CoinPedia has been delivering accurate and timely cryptocurrency and blockchain updates since 2017. All content is created by our expert panel of analysts and journalists, following strict Editorial Guidelines based on E-E-A-T (Experience, Expertise, Authoritativeness, Trustworthiness). Every article is fact-checked against reputable sources to ensure accuracy, transparency, and reliability. Our review policy guarantees unbiased evaluations when recommending exchanges, platforms, or tools. We strive to provide timely updates about everything crypto & blockchain, right from startups to industry majors.
Investment Disclaimer:
All opinions and insights shared represent the author’s own views on current market conditions. Please do your own research before making investment decisions. Neither the writer nor the publication assumes responsibility for your financial choices.
Sponsored and Advertisements:
Sponsored content and affiliate links may appear on our site. Advertisements are marked clearly, and our editorial content remains entirely independent from our ad partners.