
BitcoinWhile it attracted attention by briefly exceeding the $ 90,000 level in the last days of the year, the general picture in the market differs significantly from previous bear cycles. The price has been moving in a narrowing upward band for weeks, revealing a digestible volatility structure instead of sharp sales. In particular, maintaining long-term technical thresholds weakens the scenario of a possible hard collapse. Market actors are of the opinion that we have entered a period in which the usual bear market behavior will not be repeated.
Historical Bear Market Dynamics Not Working This Time
Bitcoin has followed a similar technical scenario in the past in the 2014, 2018 and 2022 cycles. The price has fallen below the 100-week simple and exponential moving averages. These indicators then crossed downwards, followed by sharp declines in the range of 40 to 55 percent within a few weeks. The intersections in question bear marketIt represented not the beginning of the crisis, but its most destructive phase, and paved the way for the liquidation of the last weak hands in the market.
The last weekly close of 2025 broke this tradition. Bitcoin managed to hold above losing levels in past cycles and did not turn into a threatening bear crossover selloff. The price’s failure to gain downward momentum indicates that the market is rejecting the expected breakout. In terms of technical analysis, bear signals that fail generally indicate strong underlying demand.
Although this chart does not mean that the bullish market is certain, it does reveal that one of the most important bearish triggers that has been followed for a long time has lost its validity. The market structure is balanced without entering the panic selling phase seen in previous cycles.

Possible Short-Term Scenarios for Bitcoin
For a 40 percent pullback to occur, Bitcoin must lose multiple strong support areas in a row. Falling below the 100-week averages on a weekly basis and permanent pricing in the last demand areas are among the prerequisites for this scenario. In the current view, none of these conditions are met.
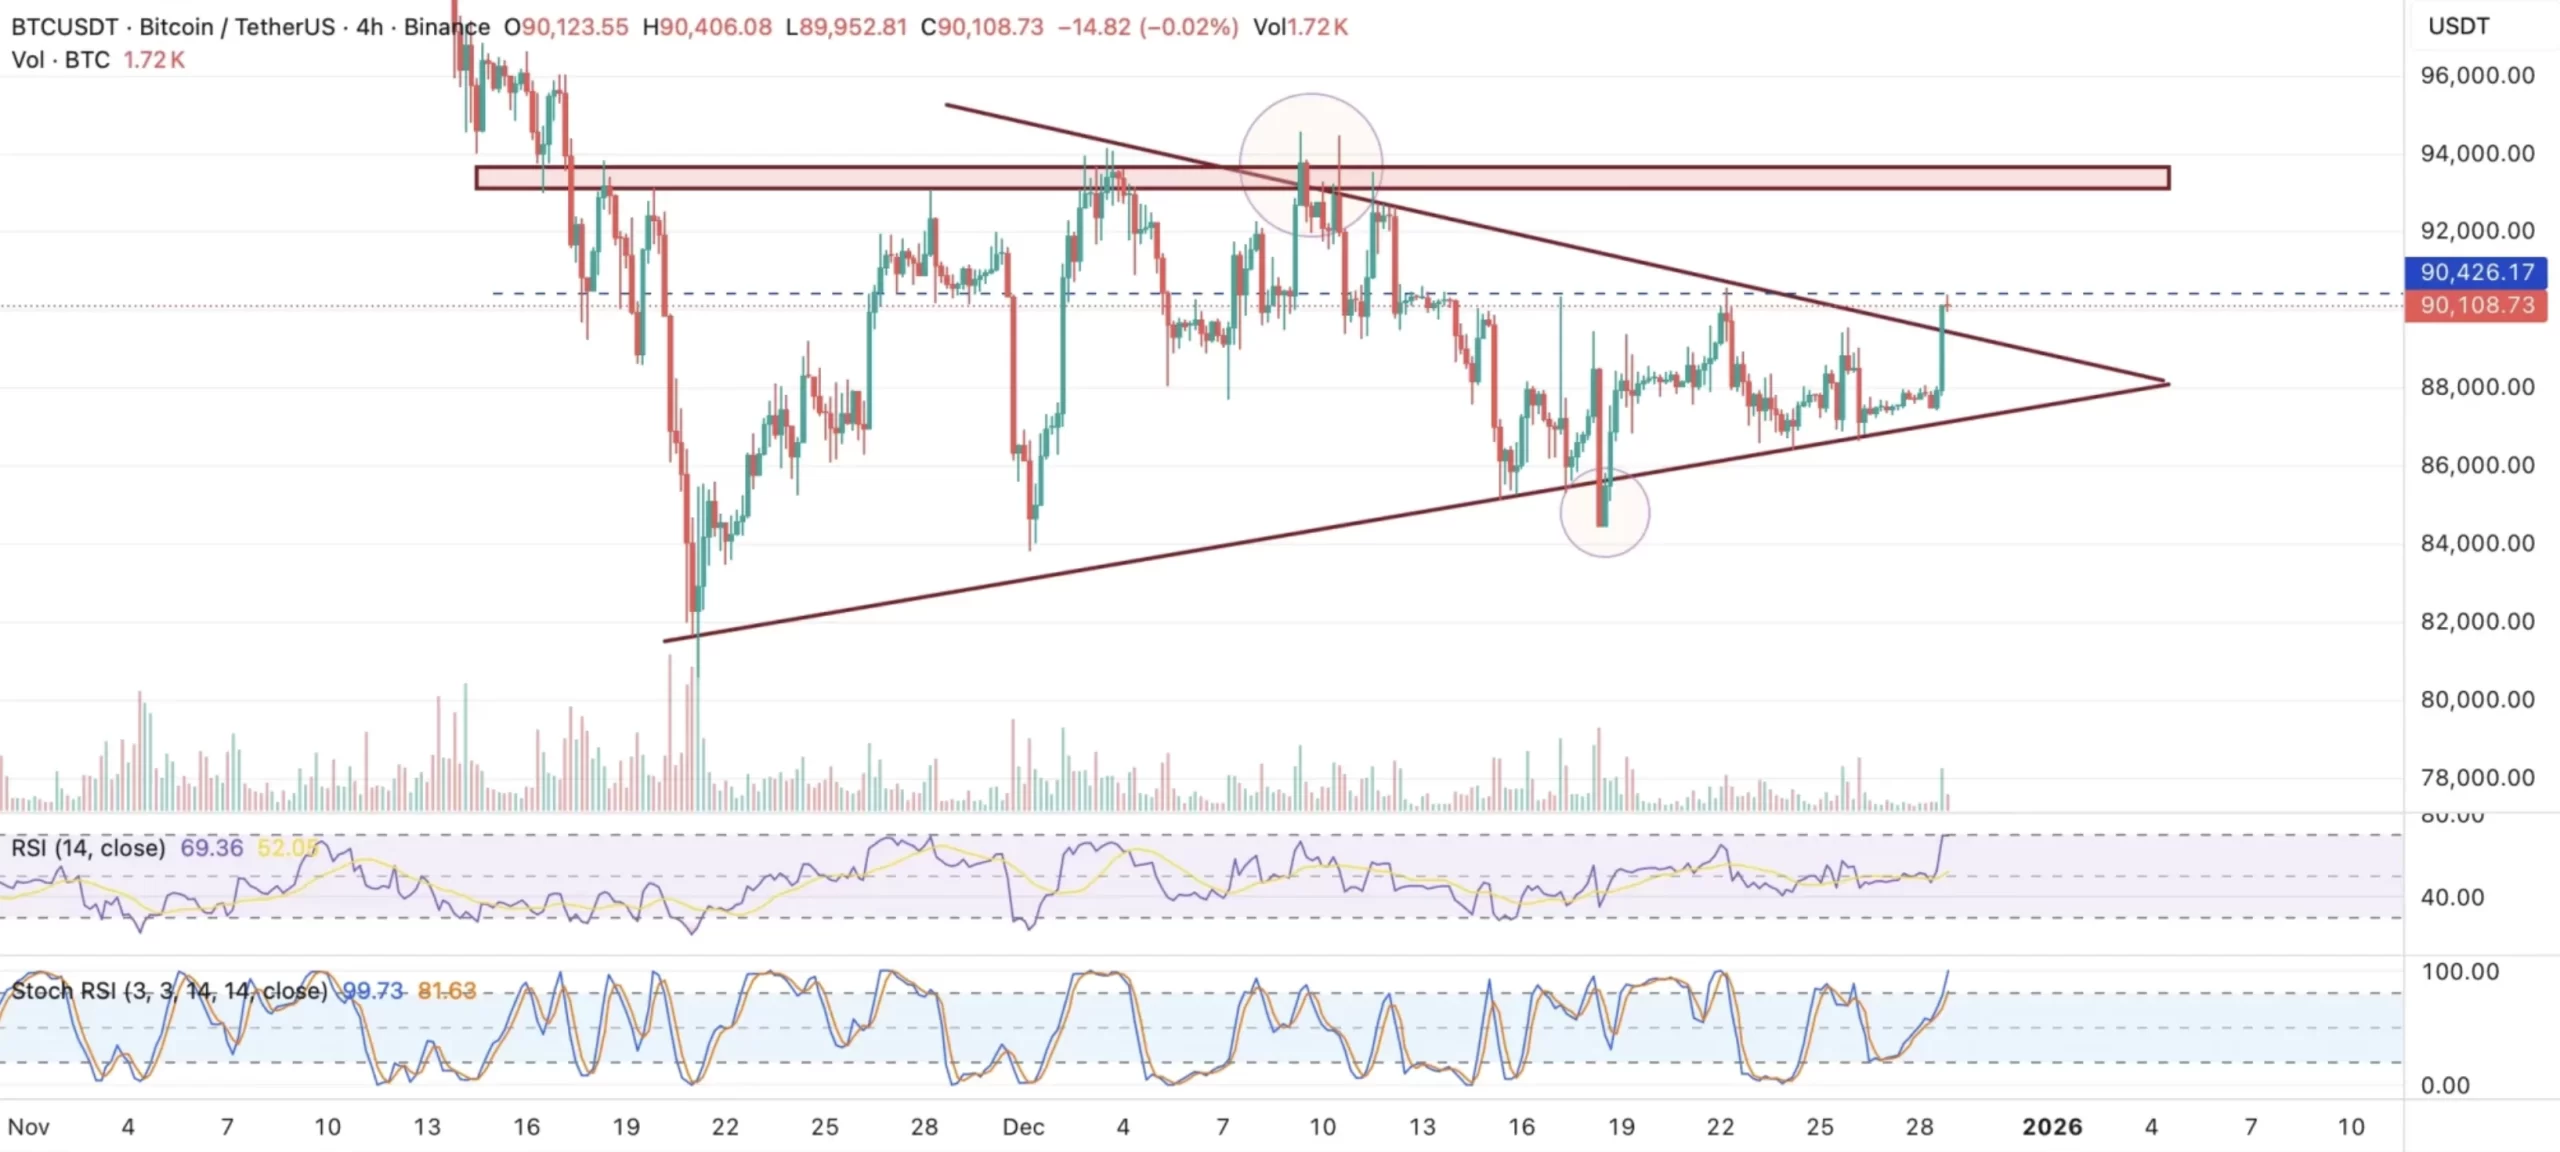
In the short term, momentum indicators point to the need for caution. Seen on the four-hour chart symmetrical triangle formationAn upward break of carries the price to the $90,500 region. RSI And Stochastic RSI It has entered the overbought area. If the selling pressure increases, it may fall below $ 90,000 again. Around $89,500 stands out as an area where demand may occur again.
On the other hand, if the price remains above the old falling trend line of the triangle and is accepted above $90,500, a new movement area may be opened towards the $93,000–93,650 band. Such a development may confirm that a stronger technical basis has formed as we enter 2026.
CryptoAppsy According to data, Bitcoin is trading at $89,468 with an increase of 2.13 percent in the last 24 hours at the time of writing.