
Ethereum  $2,977.48stands out among crypto assets that have had difficulty finding direction in recent days. While price movements are narrowing rather than expanding, the decline in volatility indicates that the market has become unstable. Both technical indicators and on-chain data indicate that Ethereum remains in a squeeze rather than a clear trend in the short term. While this picture causes investors to act cautiously, critical levels have become even more important for a possible breakout.
What Does Ethereum Say on Daily and 4-Hour Charts?
On the daily timeframe, Ethereum is trading between a long-maintained declining trend line and strong horizontal support near $2,500. This falling trend line continues to act as a dynamic resistance, rebuffing the price with every attempt to rise. Although buyers step in from time to time, these efforts are not enough to create a permanent breakout. This situation clearly shows that there are still strong sellers in the market.
On the downside, the $2,500 level works as a critical line of defense. The selling pressure in this region in recent weeks was met by buyers, preventing a deeper retreat. As a result, Ethereum is moving in a directionless compression formation. The fact that daily closings do not occur outside this band shows that the consolidation process continues.
On the other hand, the short-term market can be read more clearly on the four-hour chart. Although ETH formed a flag formation with the reaction from local bottoms, its upward breakout attempt failed. After falling below the support for a short time, the price quickly recovered and created a false breakout. This move left limited space for buyers while trapping short-term sellers. However, the fact that the price has not entered a strong upward trend again shows that this reaction remains a correction for now.

ETF Exits, On-Chain Data and Other Developments
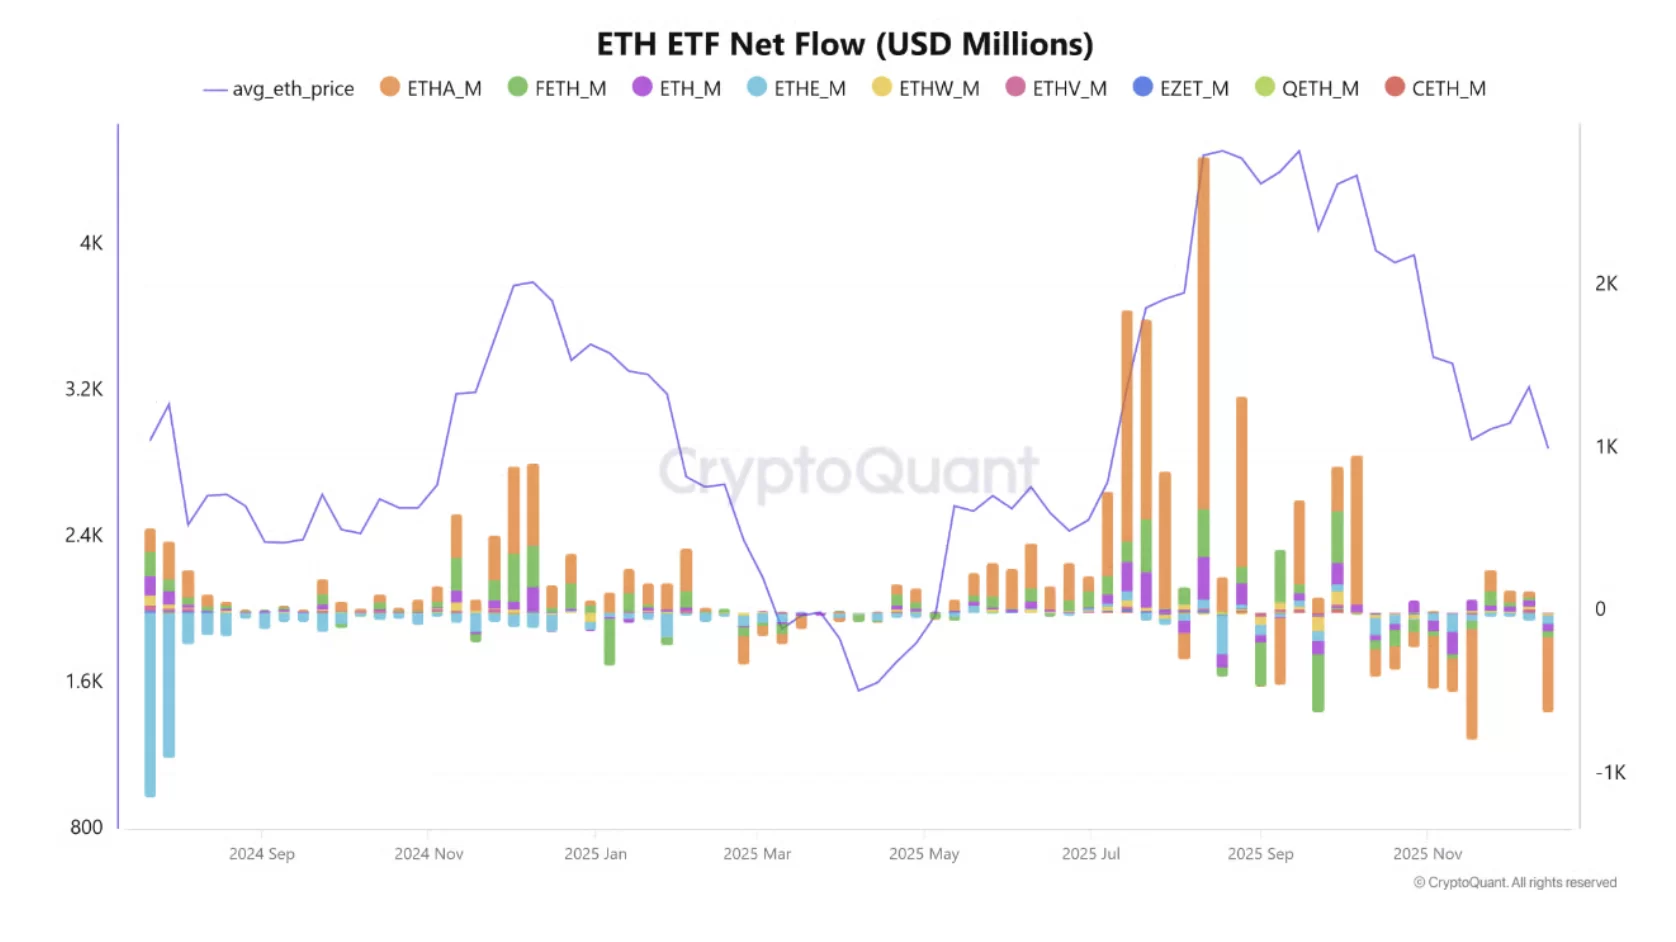
In addition to the technical squeeze, on-chain data also paints a cautious picture for ETH. Strong institutional outflows from spot Ethereum ETFs in mid-December attracted attention. In particular, the outflow of hundreds of millions of dollars from BlackRock’s Ethereum ETF revealed that corporate risk appetite has weakened. The fact that total weekly outflows exceeded 600 million dollars shows that buy-side liquidity has narrowed significantly.
The timing of these developments is also very critical. The intense outflows at the beginning of the week are weakening Ethereum’s ability to defend important support levels. The reduction of positions by institutional investors at current prices stands out as a factor that increases downside risks in the short term.
On the other hand, a different development regarding the Ethereum ecosystem also draws attention. Increasing transaction volume and lower transaction fees in some large Layer-2 projects in recent days indicate that the usage on the network is shifting from the main chain to side solutions. Although this supports the scalability of Ethereum in the long term, it causes demand on the main network to be limited in the short term.