
Bitcoin  $87,270.31While the price of is trending horizontally in the $86,000 range, the market maintains its cautious outlook. The “Golden Cross” signal, which investors closely follow, has come to the fore again. Popular trader Merlijn The TraderHe claimed that the intersection, which has formed for the fifth time since 2020, could trigger a strong bullish cycle in the coming months. According to the analyst’s analysis, the target level may extend up to $ 130,000.
Why Does the Golden Cross Signal Stand Out in Bitcoin?
According to the chart shared by Merlijn The Trader, Bitcoin has reached the fifth level since 2020. golden cross recorded its formation. In technical analysis, this formation, which emerges when the short-term average crosses the long-term average upward, attracted attention because it emerged in periods when confidence was low in the past cycles.
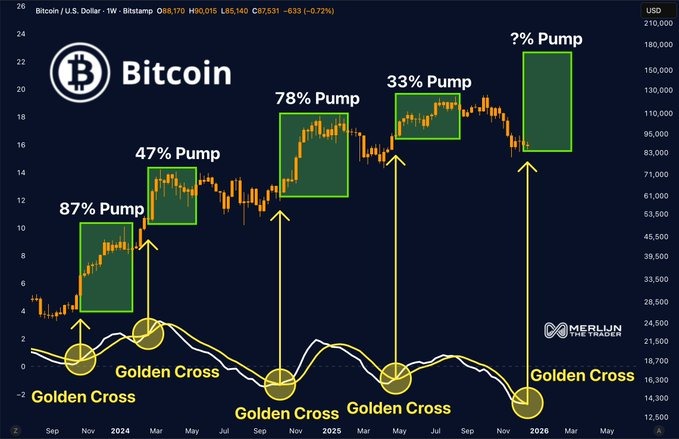
In historical examples, the price response was not instantaneous. First, it takes weeks, even months. consolidation phase was seen. Then the upward movement gained momentum. In the past performance series cited by Merlijn, it is noteworthy that Bitcoin recorded increases of 87 percent, 47 percent, 78 percent and 33 percent, respectively, after similar intersections. This strengthens the view that the intersection often indicates the preparation phase, not the top. Therefore, the signal is positioned as an indicator that keeps alive the expectation that a trend may be starting in volatile and uncertain market conditions.
Price Targets Indicated by the Technique
While the price is currently around $86,600, it is calculated that even a 33 percent movement, which is the lowest similar increase in the past, could open the door to around $115,000. In a medium-sized scenario, an acceleration of around 45 percent could push Bitcoin to the $130,000 region. In case of a more aggressive cycle repeat, the $145,000–155,000 range is also on the table.

On the other hand, pressure factors come to the fore in the short term. According to Glassnode data, approximately 6.7 million units BTC is kept at a loss. This chart means a supply wall that could increase selling pressure in the $90,000–$95,000 range.
The weakening of liquidity during the holiday period also paves the way for sharp but temporary fluctuations. In addition, the fact that the latest buying appetite comes mainly from derivative markets stands out as another factor indicating that long-term demand on the spot side has not yet become dominant.