Altcoin burns cause deflation and cause the price to rise. However, this is not always the case. For example, if there is a larger new supply export than burning, it will only help balance inflation, that is, it will not cause deflation. kyle today HYPE Coin He focuses on exactly this in the background of his burnings.
HYPE Coin Burns
new generation DEX Hyperliquid is a very strong DeFi player and competes with Aster. After the FTX crash, decentralized cryptocurrency exchanges increased in popularity, and DEX platforms with improved UI aspects received more attention than expected. HYPE Coin That’s how it managed to create continually larger peaks throughout 2025.
Now they are turning to burns to offset volatility in overall market sentiment and outflows on the corporate side. However, Kyledoops shares the calendar below and says the burns may not be that deflationary.


“Everyone is focused on the HYPE burning proposition, but the supply dynamics don’t stop there.
Here is the full picture:
- Hyper Foundation proposes burning 1 billion HYPE from its Relief Fund.
- Address holds ~37 million HYPE → circulating supply will decrease by more than 10% if burning is approved.
- The final decision will be made by a share-weighted confirmatory vote on December 24.
Now the other side of the equation:
- Unlocking ~10 million HYPE is still planned for this month.
- If the burn fails, the pressure to unlock becomes the dominant factor.
The result depends on the balance:
How smoothly the unlocking with the burn confirmation will be absorbed.
“To take a position, you have to monitor the real supply.”
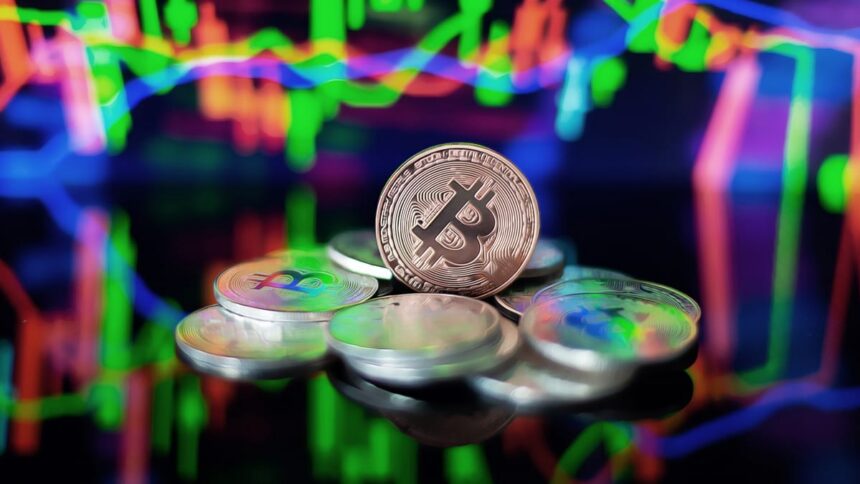
Bitcoin (BTC) Takes Flight
US markets opened at the time of writing and Bitcoin  $87,270.31 The price first saw a rapid decline and then a recovery. It is possible for investors to continue reducing their risks today, as the US inflation data will be released tomorrow and the Japanese interest rate decision will be released on Friday, meaning the coming hours will be very active. Of course, cryptocurrencies are always full of surprises.
BTC CME Futures Open Interest has fallen to half of its peak in 2025. Following the October 10 drop, large leveraged positions were liquidated and we are moving into a period of rebalancing. DaanCrypto is happy with this.
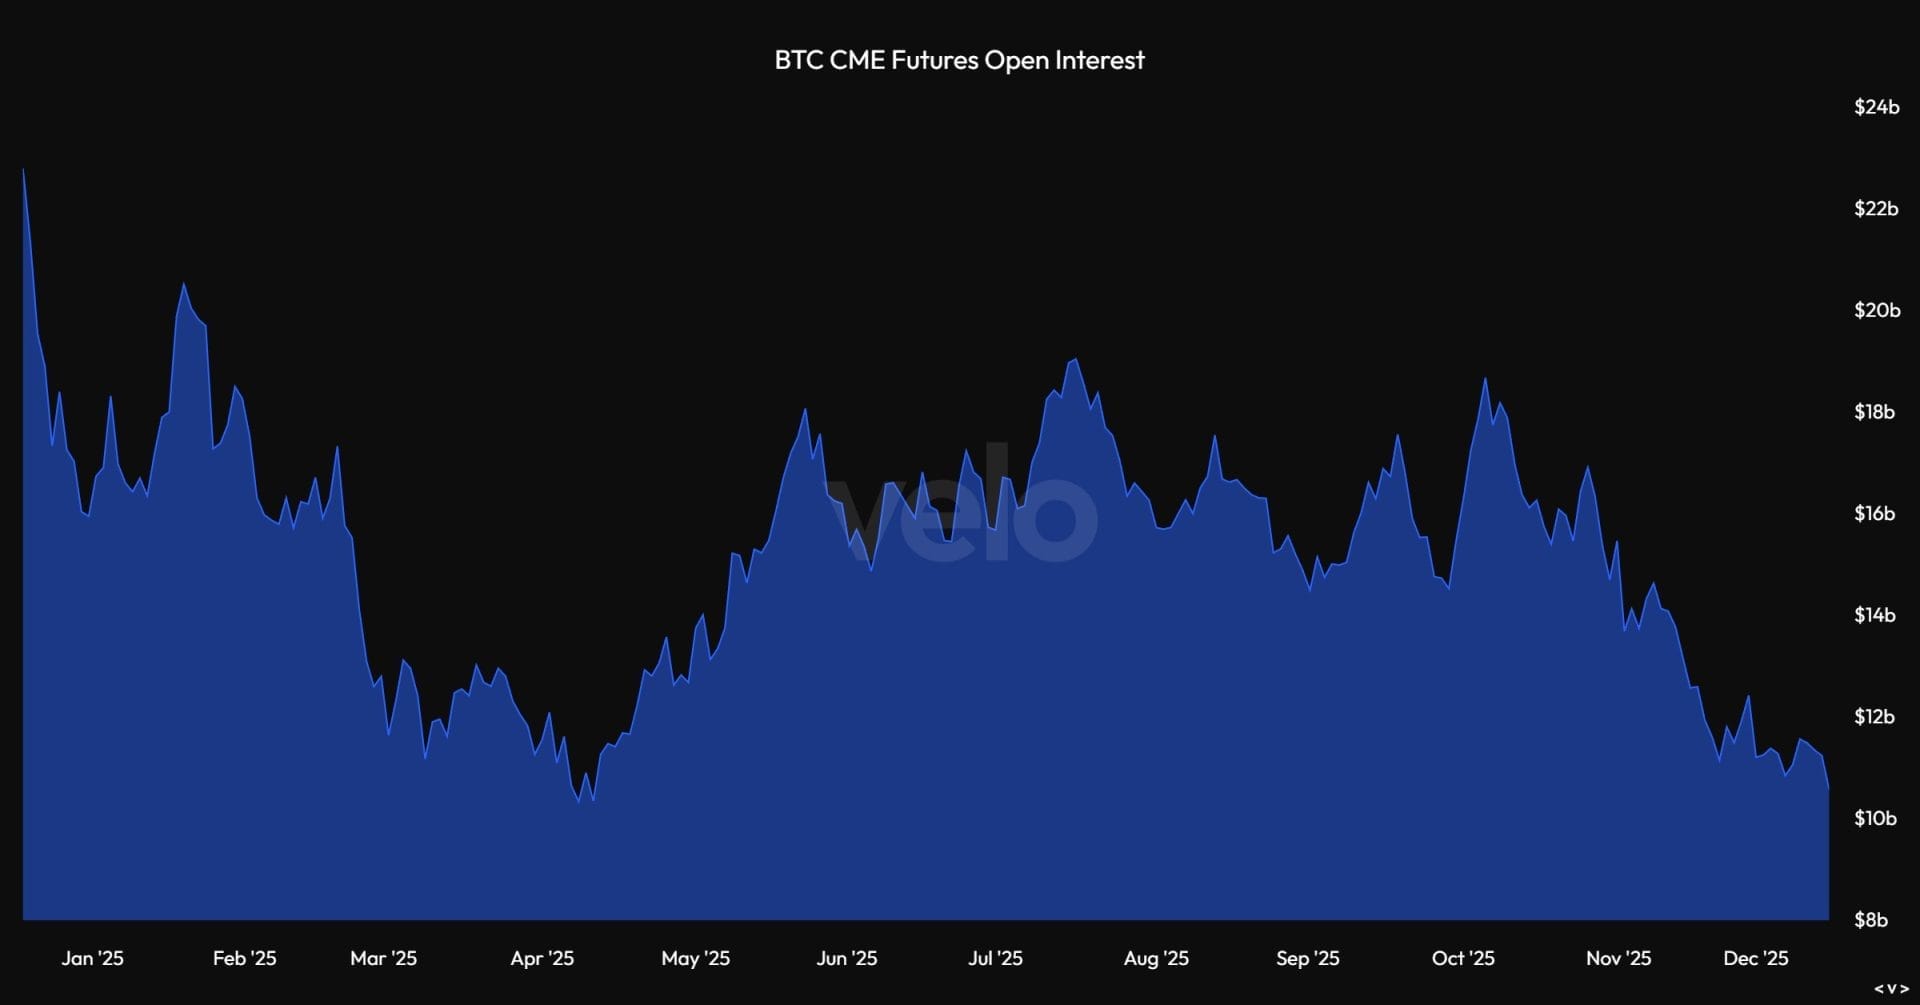
“The only thing that matters right now is the spotlight and ETFs Ultimately, the market finds a suitable equilibrium point from which it can rebalance. The market is far from warming up, at least not anytime soon. “So even if we see some relief in the first quarter, there’s still a lot of room there.”
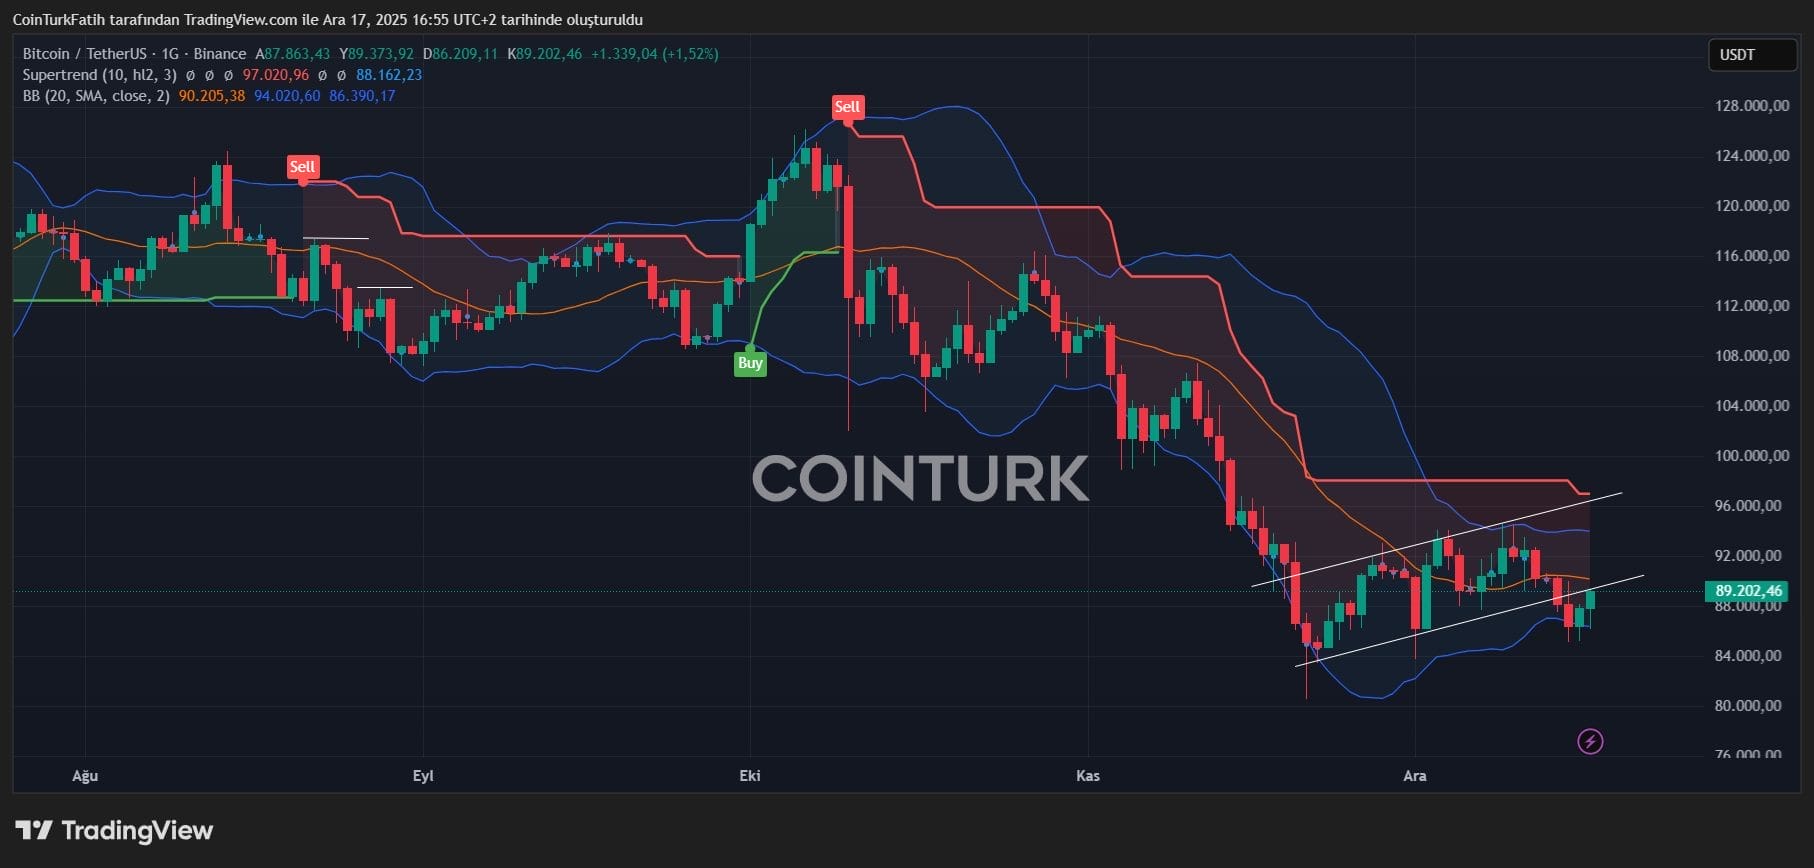
It’s nice to clear up excess leverage. And what’s better is that by the end of the article, BTC suddenly jumped above $ 89 thousand and quickly moved to $ 90 thousand. This happened very quickly. If it can hold strong, a break below the bear flag could trigger a fake move and the price could test the top at $96,800. Crypto is literally full of surprises.