
Bitcoin (BTC)  $86,219.53 With its ongoing closes below $100,000, it screams that this could be more than a temporary correction. Even though it’s annoying cryptocurrency Volatility in the markets is always high and this is what makes it attractive. These days we see the side of volatility against the bulls. Davis looked at the USDT market value chart and warned that the sale could deepen.
Cryptocurrencies May Fall
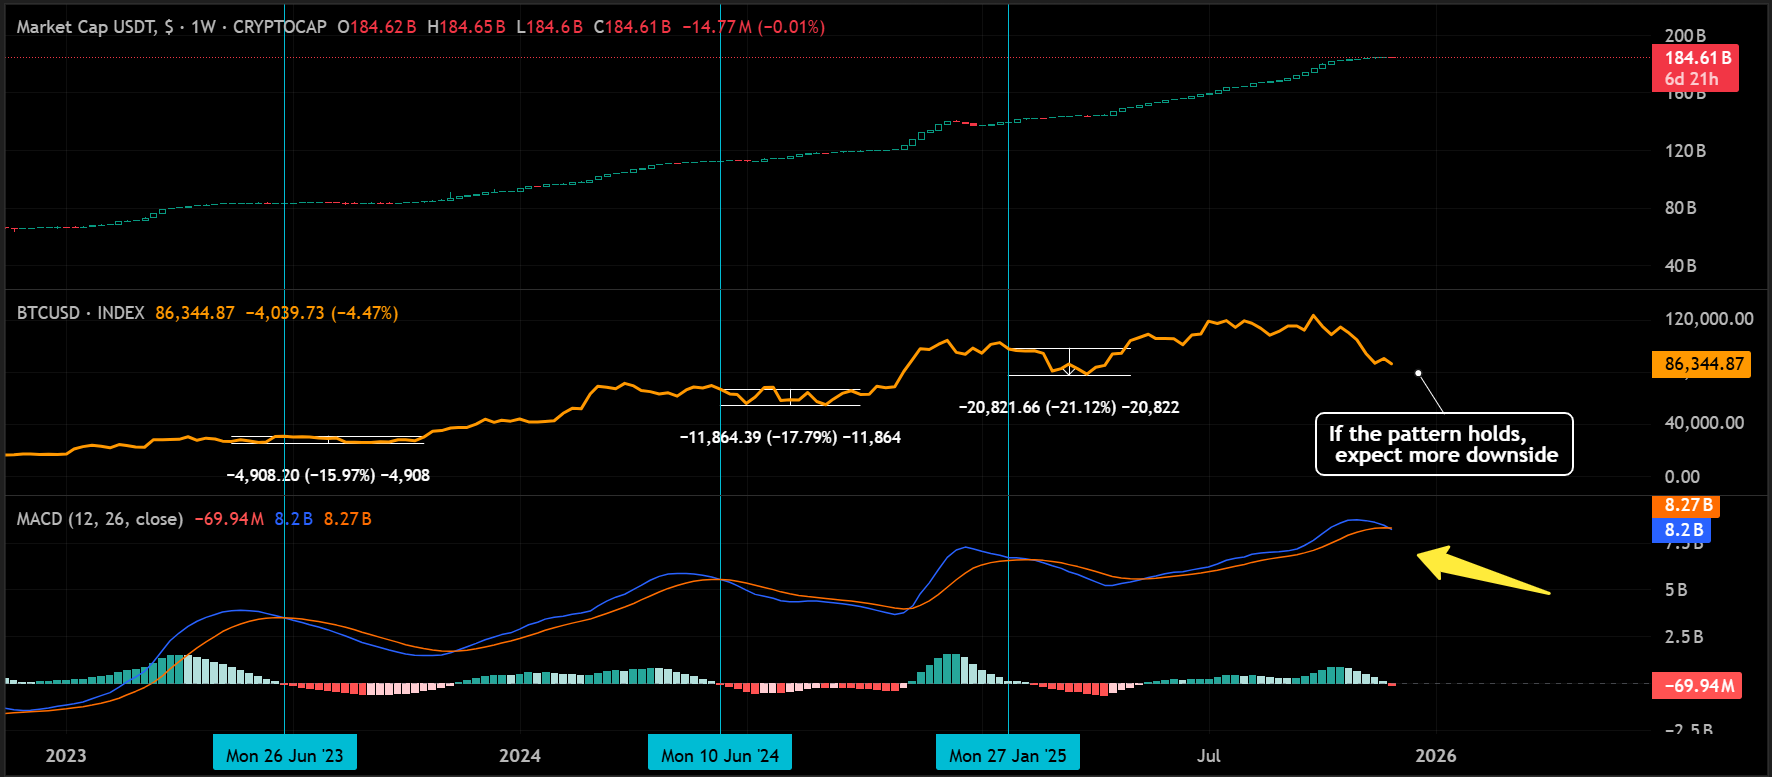
Looking at the USDT market value chart, the analyst wrote that the buying pressure has weakened significantly as the MACD formed a death cross on the weekly. The analyst warned of deeper bottoms, reminding that in the past this signal had heralded declines between 15-21%. If the current trend continues BTC It may bottom close to 70 thousand dollars. But history doesn’t always repeat itself, and such a big drop would land us in the middle of a bigger crash than the FTX or COVID era.
Although investors could not fully understand the extent of the loss as BTC was at higher levels compared to its usual price, BTC lost significant strength. The latest decline is not much different from BTC’s decline from 69 thousand dollars to 30-40 thousand dollars.

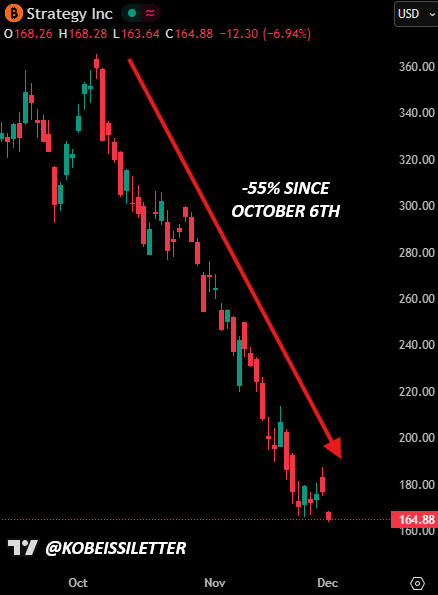
MicroStrategy It fell over 7% today, falling to its lowest level since October 2024. The stock has lost 55% of its value since October 6, one of the sharpest declines in its history. After exceeding the peak of the dot-com bubble, it was very meaningful for MSTR to experience a decline reminiscent of the dot-com bubble period.
Investors Expect a Decline
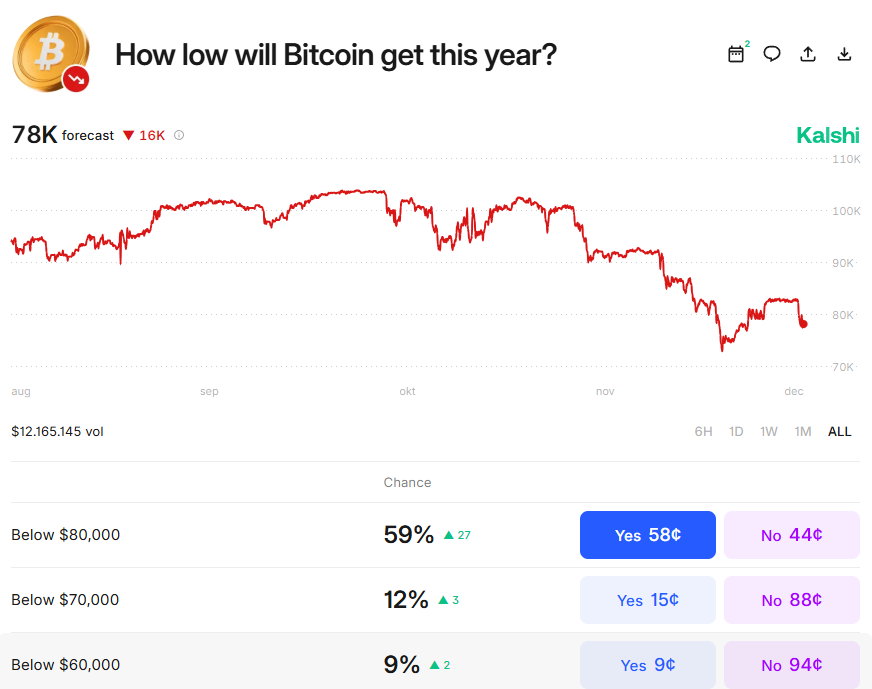
BTC price BTC is lingering below the key $88,000 support, at the $85,000 level and lowering its daily bottom. However, there is a dominant tendency in the prediction markets that the year, that is, December, may be closed at lower levels. We also wrote that the opposite position was taken in the option markets compared to last year. While last year call options dominated at unprecedented highs, now it is dominated by put options at new lows.
DaanCrypto noted the change in sentiment and wrote:
“What we see here is the current price calculated by the average volatility that will be seen in a month. This price may then shift higher or lower depending on market sentiment, trend or potential upcoming catalysts.”