
The cryptocurrency market is being viewed through a cyclical lens, with investors debating whether past market patterns still offer reliable signals. A side-by-side look at 2016 and 2026 presents a familiar tension. Certain timing and technical behaviors have resurfaced with strong similarity, showing similarity in crypto cycles. At the same time, the market’s sentiment has transformed significantly within the last ten years due to regulatory advancements and adoption.
The Bitcoin Halving Sync Between 2016 and 2026
The strongest measurable link between 2016 and 2026 lies in Bitcoin’s halving cycle. In July 2016, Bitcoin was trading near $651 when its second halving took place. The market later peaked at roughly $19,700 in December 2017 about 526 days after the halving, marking a gain of nearly 2,900%.
A similar timeline played out after the fourth halving in April 2024. Bitcoin changed hands around $63,000 at the event and reached a peak near $126,200 in October 2025, approximately 534 days later. While the timing closely mirrored the earlier cycle, the upside was far more muted, delivering roughly 100% from the halving price, or about 38% in overall returns.
Also read: Big News: President Trump Says Crypto Market Structure Bill Will Be Signed ‘Very Soon’
The near-identical timing is interesting, with both cycles topping out roughly 520 to 530 days after the halving. But the drop in returns is just as telling. Post-halving gains have fallen sharply as Bitcoin has matured, reflecting declining returns in a market that has grown from a capitalization of around $10 billion in 2016 to roughly $1.8 trillion by 2026.
The gap between the two cycles suggests that while the market still follows a familiar timing pattern likely tied to Bitcoin’s built-in supply changes, the size of price moves has faded. Growing institutional involvement has added liquidity and more stability, reducing the kind of extreme speculative surges seen in earlier cycles.
Altcoin Season Shows Similar Pattern
One of the most compelling correlations emerges in altcoin cycle timing. In Q4 2016, the ratio of altcoins to Bitcoin (ALT/BTC) bottomed, establishing a floor for altcoin underperformance. By Q1-Q2 2017, altcoin season erupted in biblical proportions: Ethereum surged 17,400% from $8 to $1,400, XRP jumped 64,000% from $0.006 to $3.84, and even marginal projects multiplied dozens of times within days.
Fast forward exactly one decade: Q4 2025 saw ALT/BTC establish a bottom once again, mirroring the 2016 pattern with near-perfect precision. As of early January 2026, the Altcoin Season Index reached 55, marking a three-month peak and suggesting early-stage entry into altseason. Historical patterns from both 2016-2017 and 2020-2021 cycles indicate that altseason typically follows within 3-4 months of such bottoms, implying Q2-Q3 2026 could see meaningful altcoin outperformance.
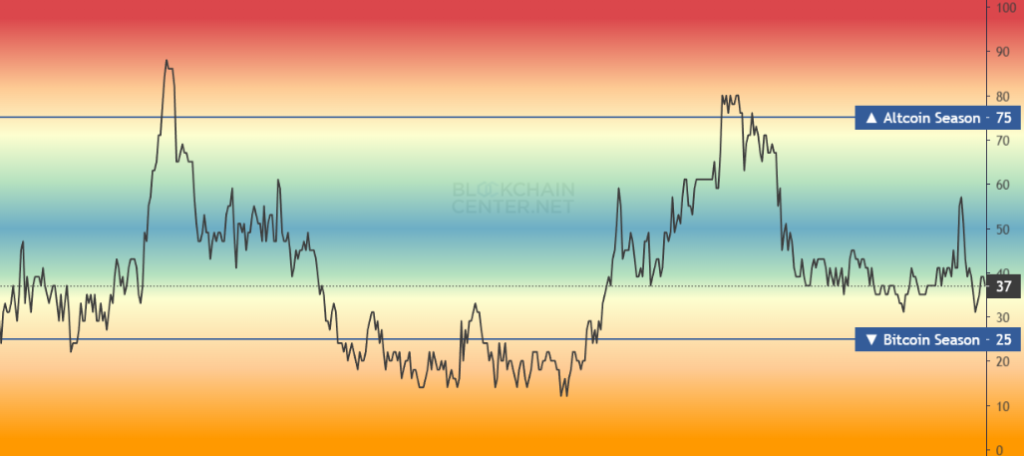
This correlation still matters because it points to the market behavior, not just the halving cycle. When Bitcoin’s dominance tops out and investors start shifting money into other cryptocurrencies, the same pattern tends to play out across different market cycles. What changes is the size of the gains.
Today’s altcoin rallies are likely to be more moderate, since most projects now operate in more regulated and transparent environments, unlike the largely unregulated market of 2017.
Bitcoin Dominance Flashes Inverse Correlation and Divergence
Bitcoin dominance: the percentage of total cryptocurrency market capitalization represented by Bitcoin, reveals a critical divergence between 2016 and 2026. In 2016, Bitcoin dominance averaged 82.6%, with the market still recovering from the Mt. Gox collapse and was dominated by Bitcoin’s narrative as “digital gold”. As altseason surged in late 2017, dominance compressed to 32%, representing a 50+ percentage point collapse in Bitcoin’s market share.
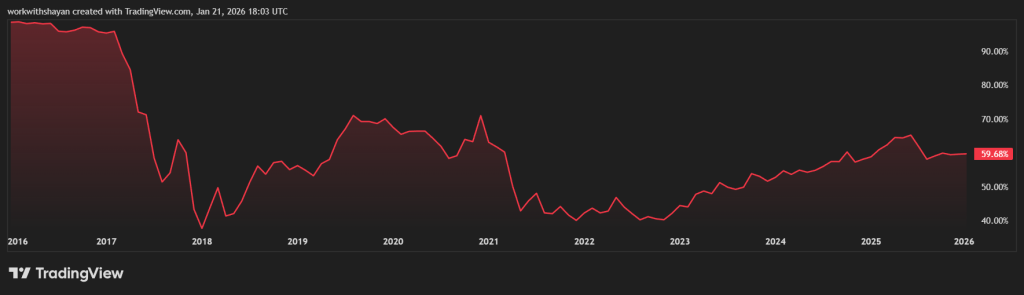

By contrast, 2026 opens with Bitcoin dominance at 59%-61%, a level that has been rising steadily since 2023 after bottoming at roughly 40% in prior years. Rather than following the 2016 trajectory of sharply declining dominance as altseason approaches, 2026’s dominance is rising, suggesting institutional capital is consolidating around Bitcoin as a core strategic reserve rather than hyping around altcoins.
Historical analysis shows that during the 2016 and 2020 halving cycles, Bitcoin dominance eventually fell to the 40% range before rebounding. The key question for 2026 is whether this support level will stay in place or if Bitcoin’s dominance keeps rising, something that would break from the idea that 2026 will simply repeat what happened in 2016.
Decline in Post-Halving Returns in 2016-2026
What stands out most is how much post-halving gains have shrunk over time. The numbers are clear:
- 2012 Halving: 9,483% return over subsequent 13 months
- 2016 Halving: 2,931% return over subsequent 17 months
- 2020 Halving: 702% return over subsequent 11 months
- 2024 Halving: 38% return (as of January 2026)
This shows a sharp decline in returns over time. With each new cycle, the gains have been roughly a fraction of what they were before. As Bitcoin’s market value has grown and more institutional money has entered the market, price swings have become smaller and more controlled.
The conclusion is clear. Even if the market in 2026 follows a similar timeline to 2016, with an altcoin rally followed by a downturn, the size of the gains is likely to be much more limited. A more mature market and lower levels of leverage make the kind of explosive returns seen in earlier cycles far less likely.
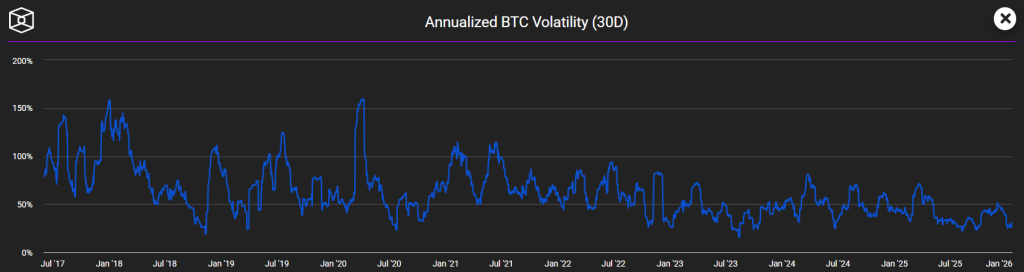
The Expansion of Bitcoin’s Volatility Floor and Capital Base
Another key divergence involves Bitcoin volatility. In 2016, Bitcoin’s 30-day average volatility measured 2.49%, seemingly modest until compared with the 4.13% volatility during the 2017 ICO boom. Yet in 2025, despite Bitcoin reaching all-time highs near $126,000 before retracing, daily volatility fell to just 2.24%, the lowest in Bitcoin’s history.
The paradox shows Bitcoin’s volatility “floor,” which has risen dramatically over the decade. In 2016, Bitcoin’s volatility floor was $366. Today, that floor stands at $76,329, a 208x increase reflecting the depth of institutional capital now supporting the asset. Spot Bitcoin ETFs, approved in January 2024, have reduced volatility by 55% compared to pre-ETF periods by providing stable institutional buyers.

This change in market structure means that even if 2026 follows the same cycle timing as 2016, the moves are likely to feel less extreme. Institutional investors now play a much bigger role, helping to stabilize prices and limit sharp drops. As a result, market behavior is different: the emotional, retail-driven excitement of 2016 has largely given way to more strategy-based investment decisions from large players.
Market Sentiment Leans Toward Allocation in 2026
Perhaps the most fundamental correlation lies in market maturity itself. In 2016, the cryptocurrency market was 100% retail-driven speculation. There were virtually no institutional participants, regulatory frameworks were nonexistent, and the entire ecosystem totaled roughly $10 billion in market cap. By 2026, over 200 public companies hold Bitcoin, governments maintain strategic reserves totaling 307,000 BTC, and institutional holdings now represent approximately 10-14% of total Bitcoin supply.
This shift in market structure helps explain why 2026 may follow the same cycle timing as 2016 but behave very differently. Institutional money now plays a major role, tying crypto prices more closely to broader economic forces like interest rates, the dollar, and bond yields, links that barely mattered in 2016, when speculation drove most moves.
Today, flows into and out of Bitcoin ETFs can reach more than $1 billion in a single day, making macro conditions the main driver of price action. That trend simply didn’t exist a decade ago.
The Halving Cycle in a More Mature Market
A main question in the 2016–2026 comparison is whether Bitcoin’s four-year halving cycle still drives the market. The evidence cuts both ways. Supporters point to familiar patterns that continue to show up, including bull market peaks arriving just over 500 days after halvings, similar late-year altcoin rotations, and bear markets that still tend to last about a year or longer.
Skeptics say those patterns matter less than they once did. Matt Hougan has argued that ETFs, regulatory clarity, and easier access for institutions have softened the boom-and-bust cycles that defined earlier eras of crypto. The data backs that up to a point. While the timing around halvings has remained consistent, the size of the gains has shrunk dramatically compared with 2016.
The result is a market that still echoes past cycles but no longer reacts the same way. Institutional participation now plays a decisive role, triggering outcomes in ways that were largely absent a decade ago.
Conclusion
The idea that history “rhymes” fits the 2016–2026 crypto cycle. Key timing patterns have repeated, with Bitcoin peaking just over 500 days after both the 2016 and 2024 halvings.
What hasn’t repeated is the scale. The explosive returns and extreme volatility of 2016-2017 are unlikely to come back in a market shaped by institutions and regulation.
The bottom line: 2026 may follow the same cycle timing as 2016, but not the same psychology or gains.