
XRPThe currency weakened on Wednesday, losing short-term support levels, and investors turned their attention to $1.85 as the sell-off re-intensified around $1.90. As we approach the end of the year cryptocurrency marketThe decrease in liquidity in 2017 caused investors to focus on short-term risk control rather than direction prediction. Intraday transactions showed that strong volume upward attempts were met with sales and the price remained under downward pressure within the tightened band. Although the room for movement remained limited in the 24-hour period, the increase in volume in critical regions indicated that larger players could be active on the sales side.
Support Break Brings $1.85 Ahead
XRP used the $1.8615–1.8700 band as “working support” for most of the trading session, but later in the day the selling accelerated and the price slumped below this bottom threshold and moved into a lower dispersion range. The role of $1.87 has changed in the short-term outlook. The threshold previously held by buyers has now become a decision zone that needs to be regained.
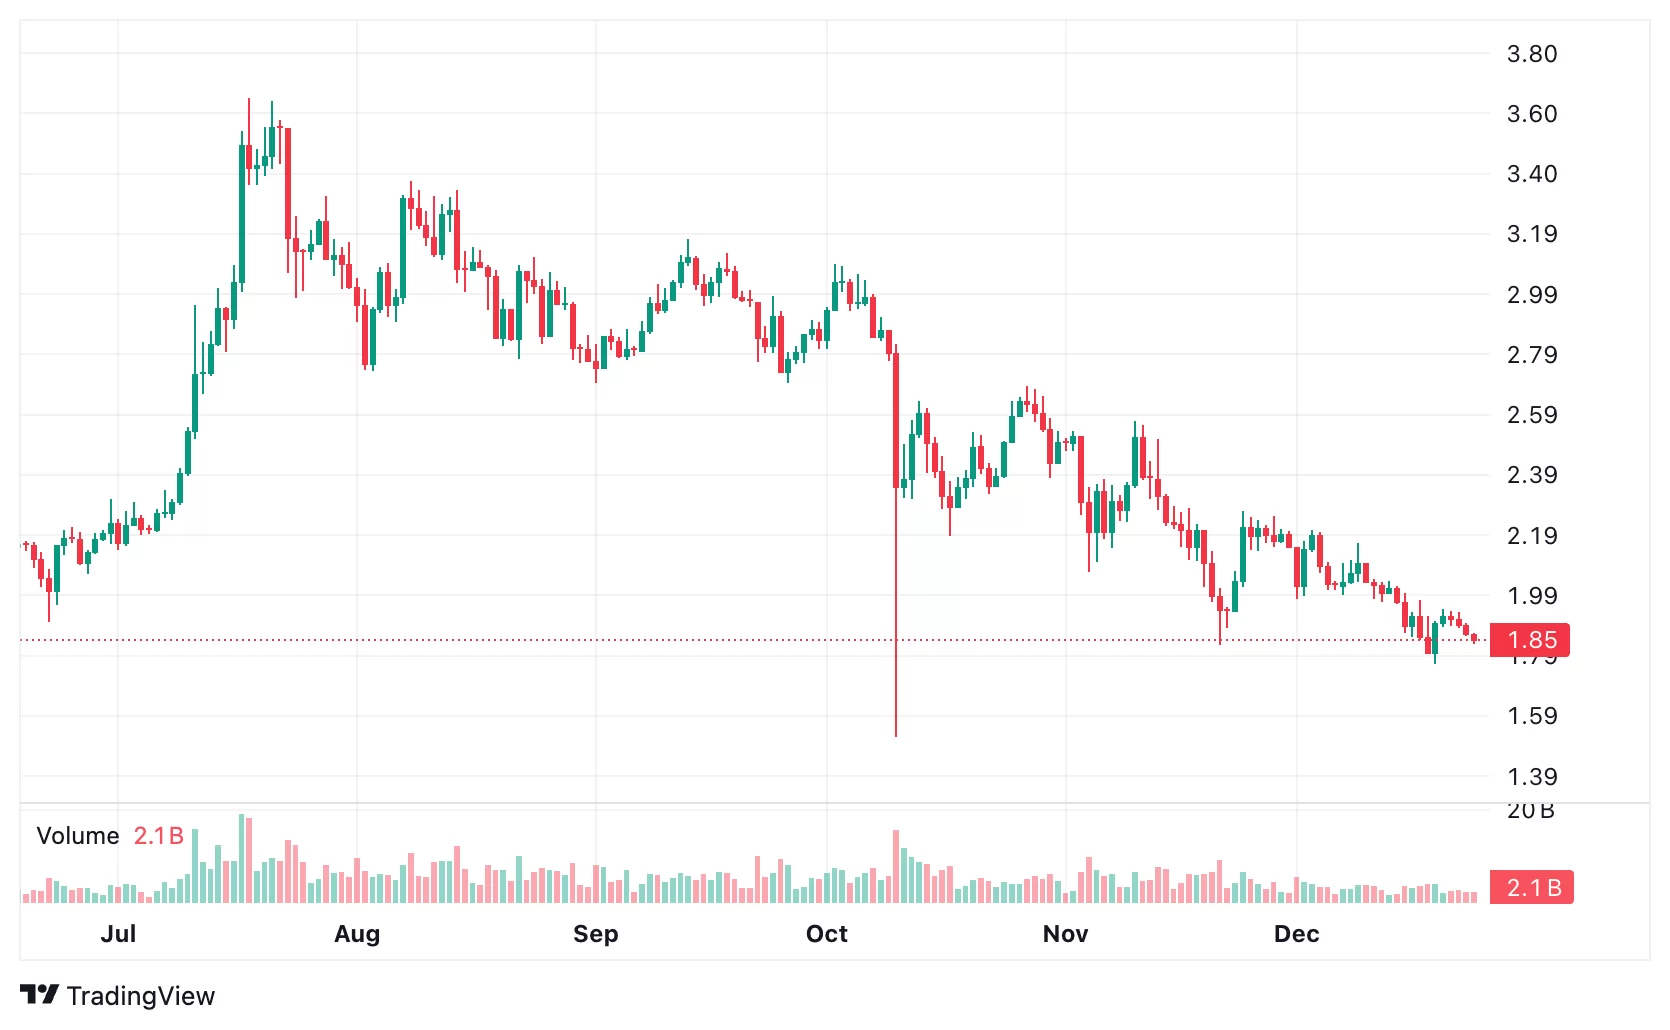
In the intraday chart, it was seen that the breakdown progressed “depending on the flow”. The decline from approximately $1.878 to 1.86 was supported by consecutive volume jumps. Especially in the decline in the $1,867–$1,865 range, 2.7 million units coinThe sudden transaction boom attracted attention. This structure suggests that the price is being pushed by selling waves rather than a silent slide.
In 24 hour performance altcoin While it decreased from $1.8942 to $1.8635, the total band remained at approximately 2.1 percent at $0.0395. While the horizontal-tight outlook was maintained, the break of the support zone moved the $1,860-$1,855 range to a new front that is expected to be defended in the short term. If buyers remain weak, the possibility of a deeper pullback may be discussed.

Crypto data platform CryptoAppsyAccording to current data provided by XRP coin At the time the news was being prepared, it was changing hands at $1.85, down 1.62 percent in the last 24 hours.
Volume Density Shows Signs of Large Sellers
The most obvious signal of the trading session was the volume accumulated at resistance. During the rejection near $1.9061, trading volume rose to approximately 75.3 million coins, almost double the 24-hour average. This table indicates that the response to strengthening price experiments is “strong selling” rather than “recovery”.
The background of the market is the year-end period. As liquidity decreases, positioning drags the price further and investor psychology shifts to short-term protection. Mixed signals on the analyst side also weaken confidence. a group rising wedge formationWhile another group argues that it may create downward pressure RSI He emphasizes that their incompatibility can be seen in local fatigue phases. The difference of opinion paves the way for rallies around $1.90 to fade more easily.
In short-term tactical language, the pattern has also become clear. Currently, the appetite for selling increases in attempts approaching $1.90, and in withdrawals close to $1.86, the search for buying at the bottom appears. A permanent change in direction depends on whether the volume will grow at the time of the breakout rather than on low-liquidity needles. Regaining $1.87 may bring the 1.90–1.91 band back to the agenda. Otherwise, $1.85 stands out as the focal point.