Bitcoin on Sunday  $85,915.61 As the price moved towards the daily close, it increased its sales and in the last 24 hours, the price dropped below 88 thousand dollars. It is not an easy process for investors, and consistently dull market conditions are wearing down altcoins. However, according to Darkfost, the opportunity alarm has now gone off.
Buy Signal in Cryptocurrencies
CryptoQuant analyst Darkfost drew attention to NVT data today. Analyst using NVT (Network Value to Transactions) to evaluate BTC’s valuation based on on-chain activity BTC It compares the market capitalization with the transaction volume on the network. Trying to determine the true standard deviation using the Z-score and the monthly and 90-day moving average, Darkfost noticed something interesting.
The 30-day moving average NVT Z-score is at −0.87, and the last time we experienced this was May 2022. In other words, Bitcoin has worn out so much that it has returned to 2022 conditions, but the price being around 90 thousand dollars gives the illusion of a price with a larger peak brought by the last cycle. So investors are not actually aware of how big the loss is.
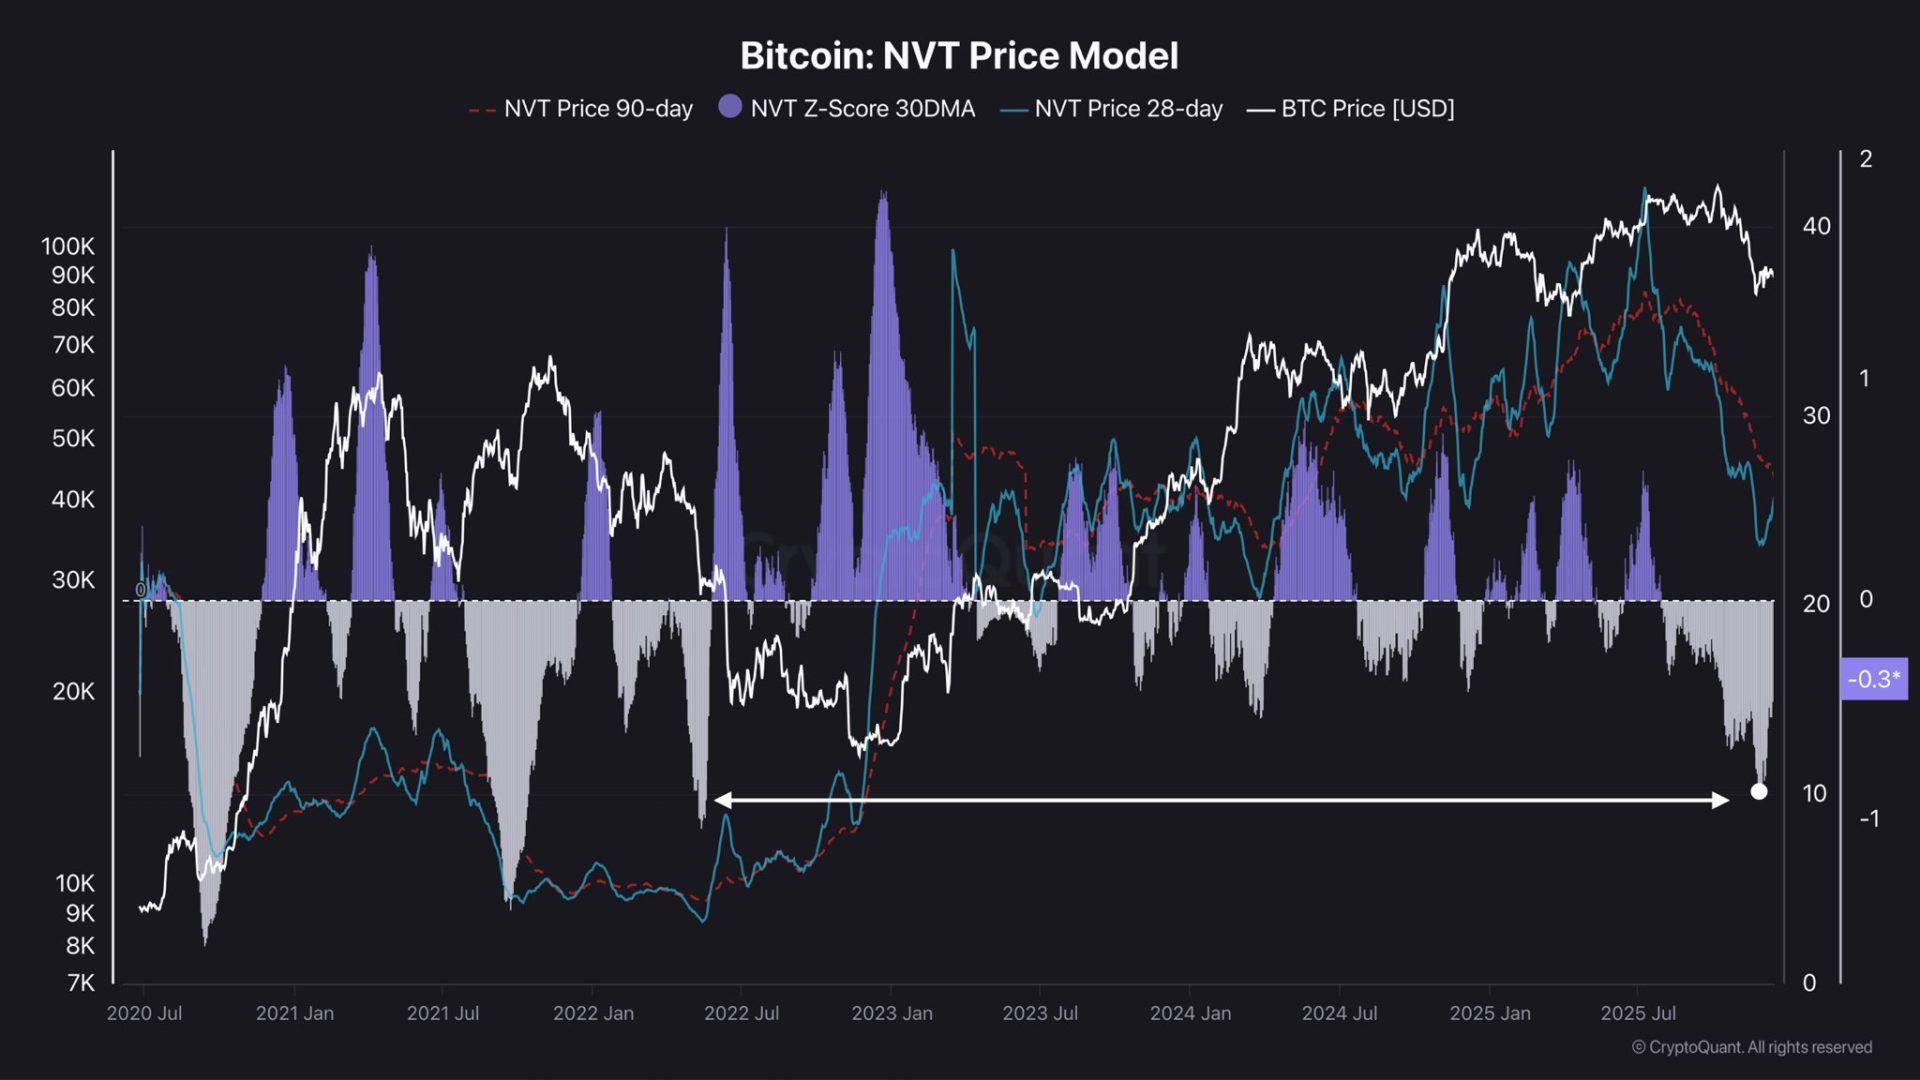

Today’s conditions are similar to BTC falling below $40k in the previous cycle. NVT There are two factors causing its decline. Declining market value and increasing transaction volumes. This signal can be viewed as a “buy opportunity” when combined with other bottom signals. The analyst wrote:
“However, what we know today is that Bitcoin’s market cap has fallen significantly in recent months, while on-chain and spot volumes have remained relatively stable (except for the sharp increase caused by Coinbase activity in late November).
In this context, BTC depreciation becomes interesting and historically, such depreciation phases have presented solid opportunities in the medium term. However, I want to reiterate the importance of being cautious. “If BTC enters a true bear market, many of the signals provided by some metrics will likely become invalid.”
Altcoin Analysis
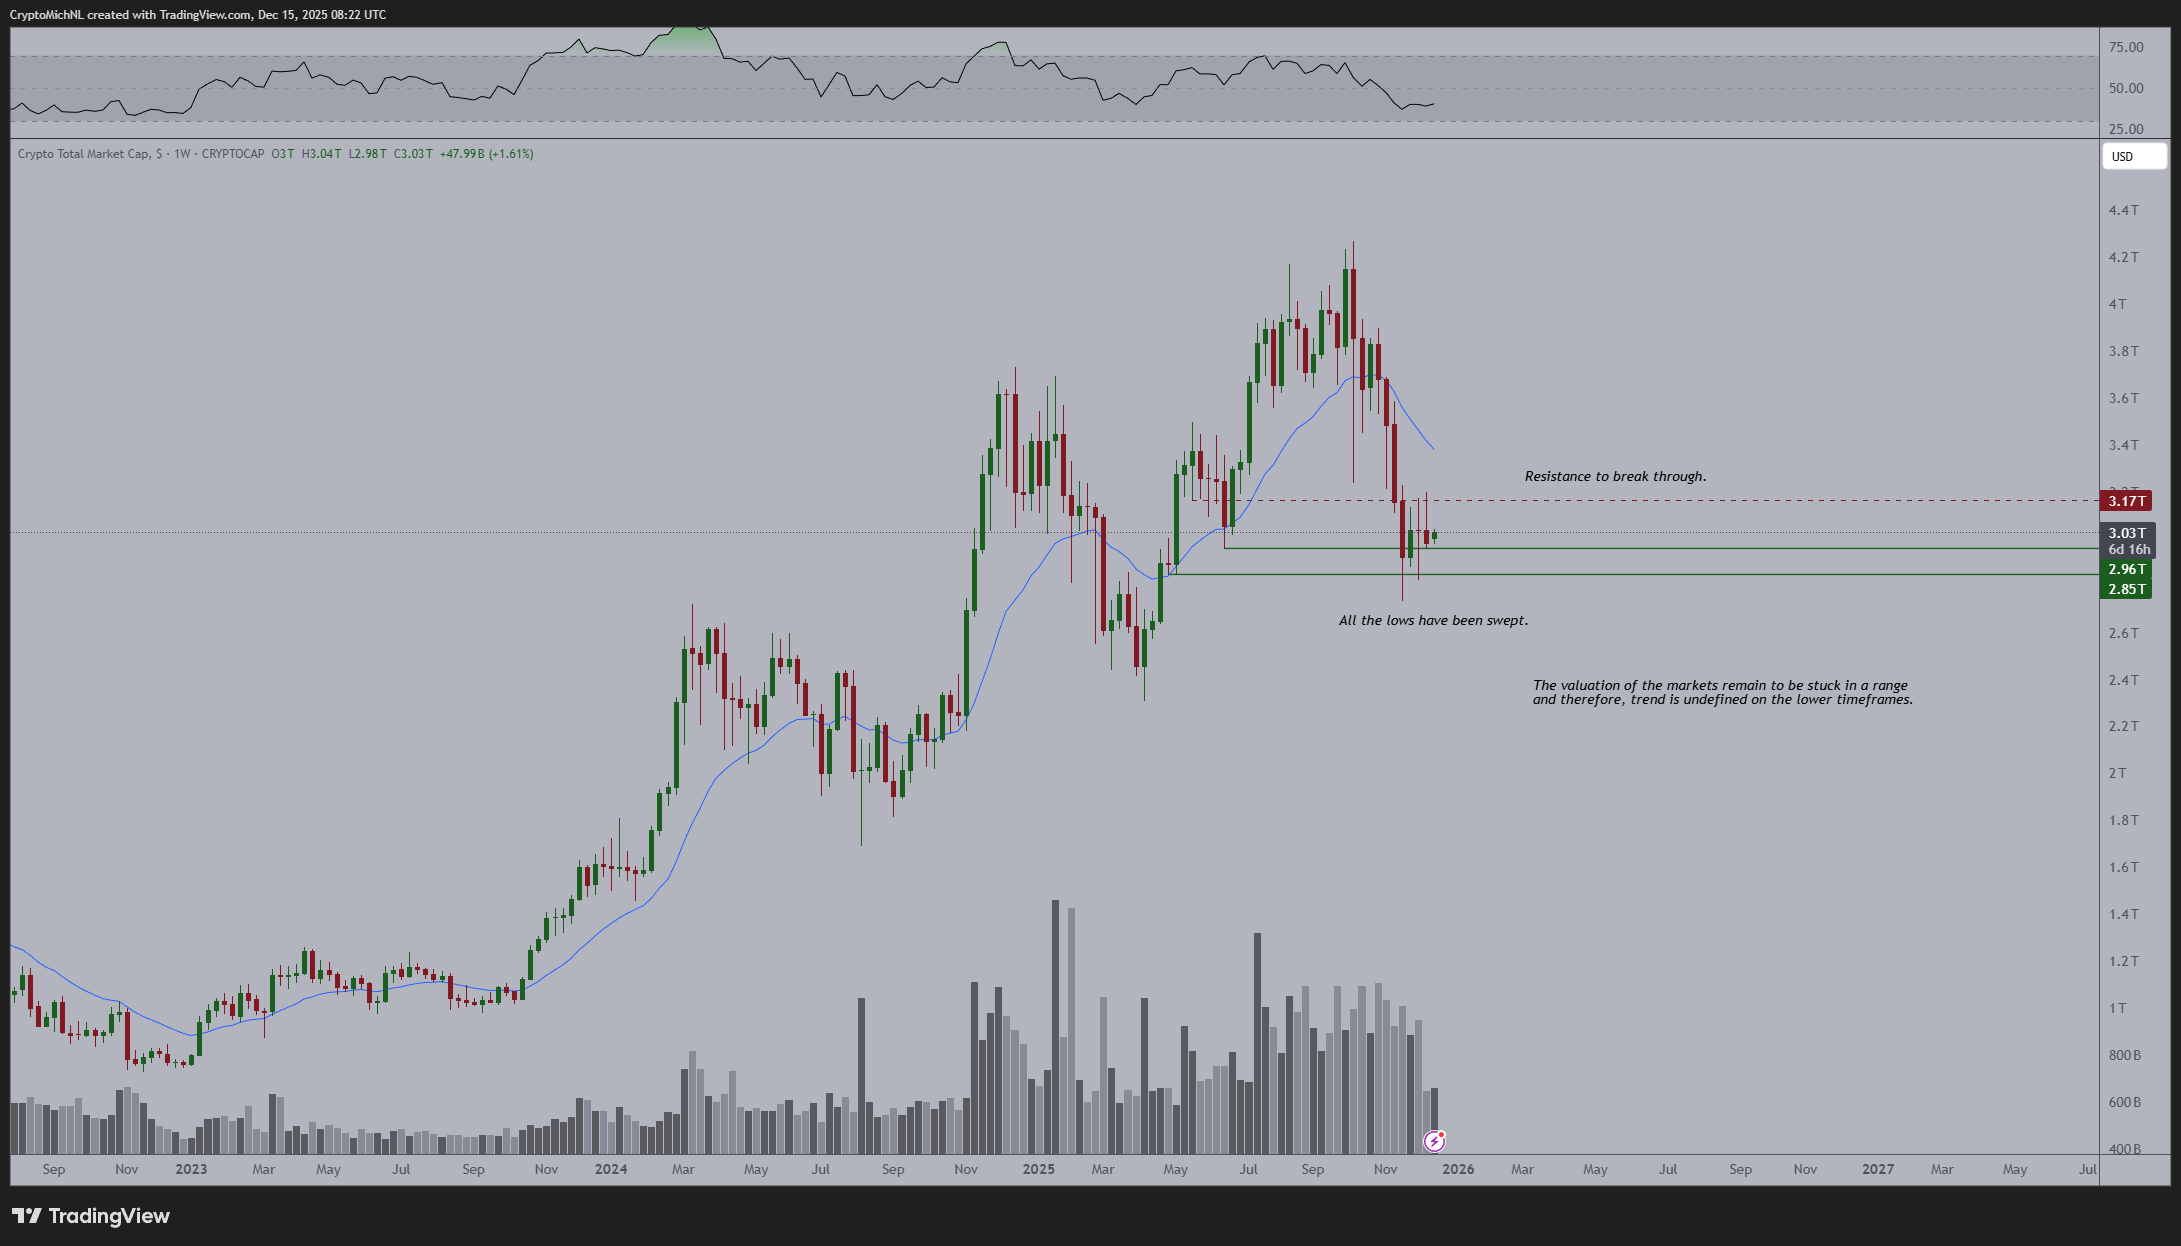
poppe today TOTALCAP He glanced at the chart and says that after a correction similar to February 2025, current conditions resemble the chart after the COVID-19 crash. The price paused for a while, the direction was unclear, and then the trend slowly began to move upwards again. $3.2 trillion and $2.85 trillion are resistance and support points under current conditions. When one of the two breaks, we will see where we are going.
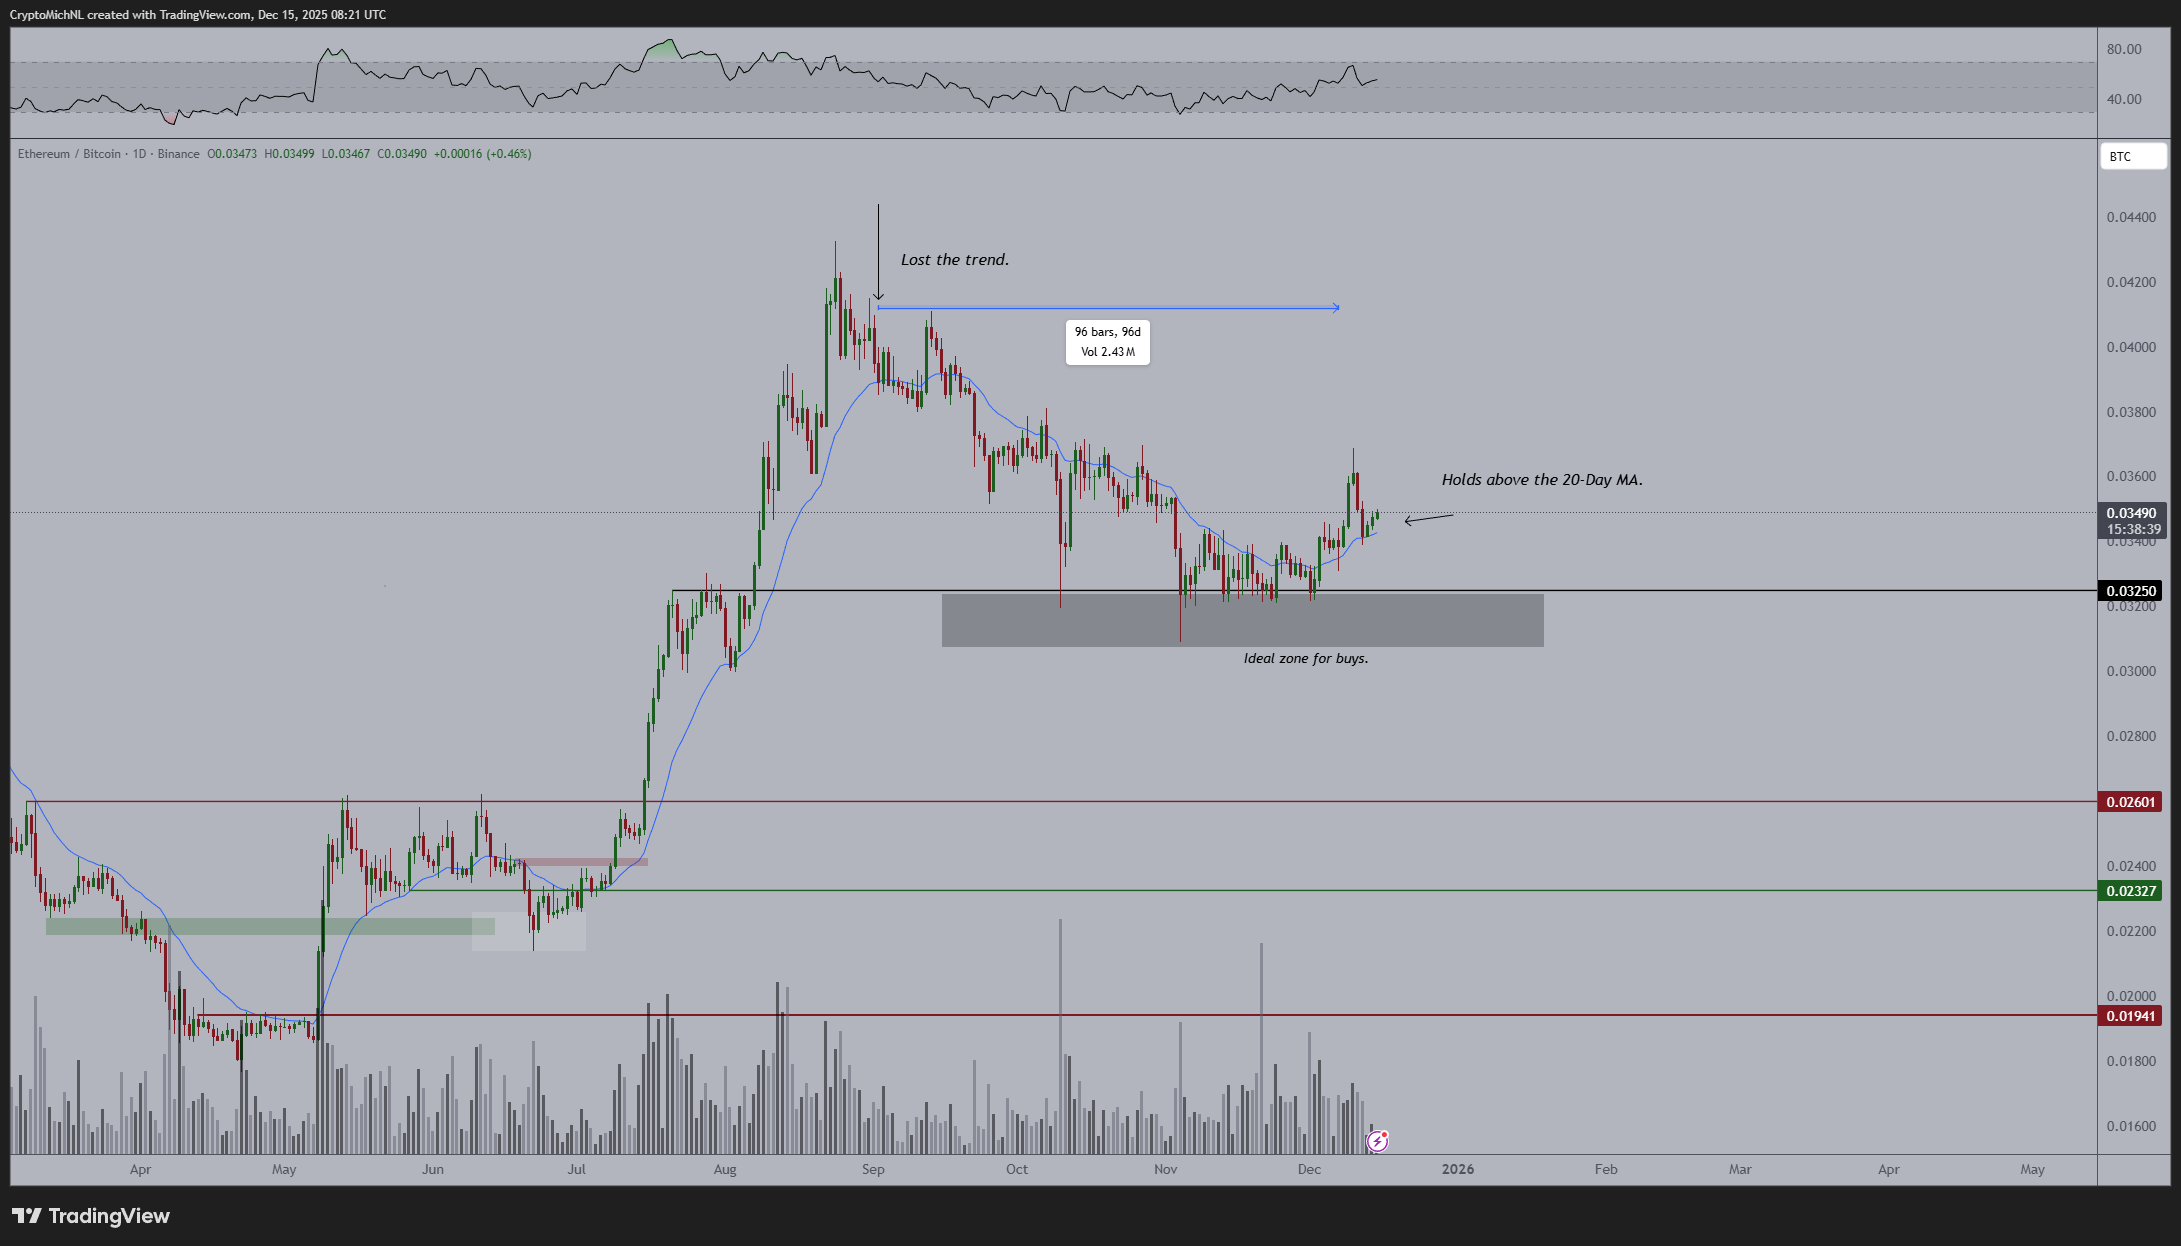
ETHBTC Taking back the 20-day moving average is another noteworthy development for altcoins these days. Although it is an early signal for now, there is hope in altcoins as ETH remains relatively strong.