
Polkadot (DOT) signals a strong return after a long period of weakness. Analysts state that the asset may have entered the “Spring” region, one of the most critical stages of the Wyckoff methodology. This phase is often seen as a harbinger of a major trend reversal and indicates that the market is preparing to rebound from the bottom.
Support Test and Rapid Reaction: Market Seeks Balance
The DOT price chart has seen a strong buyer response in the $2 band, following a sharp decline in early December. The long lower wick evident in the charts indicates a structure where the selling pressure has been broken and aggressive buying has started. This formation is known as one of the classic features of Wyckoff’s Spring pattern: a short-term sharp slide below the support level, the elimination of weak investors, and then a rapid recovery.
Following this recovery, DOT rose to the $2.30 level, but it encountered rejection there and retreated back to the $2.12 region. The price action presents a structure in which the market is trying to stabilize after a multi-month downtrend.
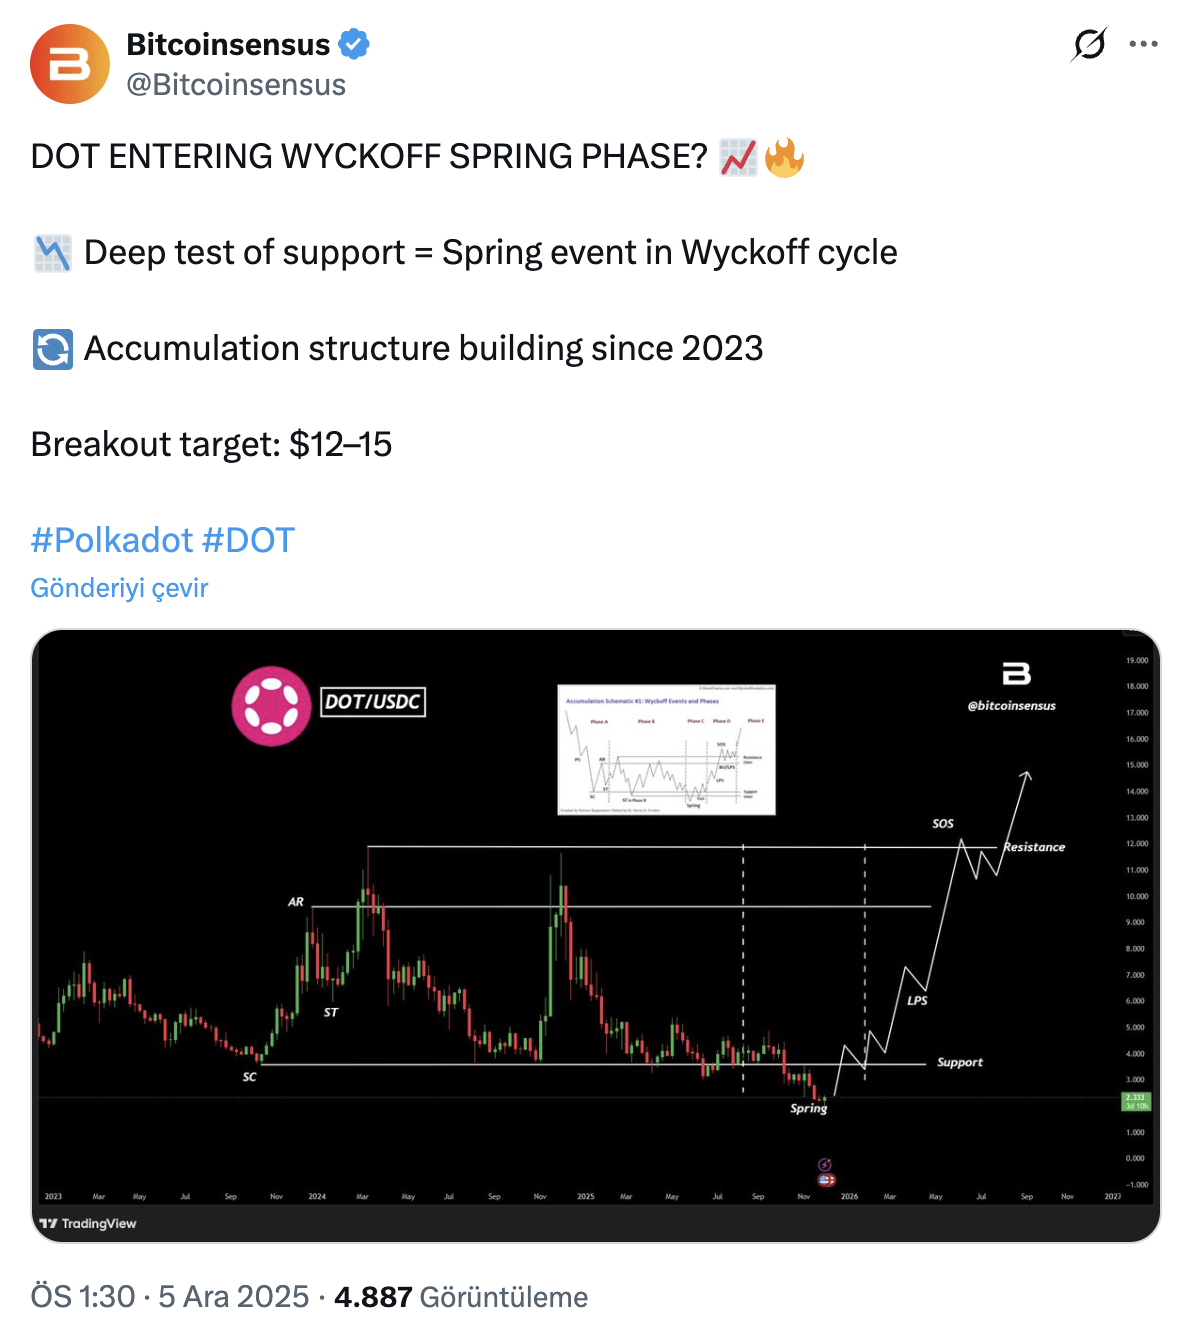
Analysts state that DOT has established its accumulation structure since 2023 and that the current deep support test is compatible with Spring criteria. According to Wyckoff theory, Spring is known as the last tremor before the start of the big rise. Analysts also state that a strong “Sign of Strength” (SOS) may occur if the $ 2.30 – $ 2.50 band is exceeded. In this case, the targeted range is shown as 12–15 dollars.

Wyckoff Road Map and DOT’s Position
The following stages stand out in the graphics of how the Wyckoff methodology works on DOT:
- SC (Selling Climax): First large volume sales wave
- ST (Secondary Test): Retesting of the support area
- AR (Automatic Rally): First strong reaction rise
- Spring: Final sag below support (DOT is thought to be in this area now)
- LPS (Last Point of Support): Formation of higher lows
- SOS (Sign of Strength): The upward momentum that starts with the breaking of the resistances
If Polkadot follows this structure, the next step is expected to be permanent closes above the mid-band resistance. If this happens, it is predicted that the price will accelerate towards higher levels.
In parallel with these technical developments, another noteworthy news in the Polkadot ecosystem recently was the activity on the developer side. In the reports published by Blockchain analysis platforms, it is re-emphasized that Polkadot is one of the most active projects in the field of Web3 development. This indicates that there is a strong growth momentum at the core of the ecosystem despite the price pressure and is interpreted as supporting the long-term outlook.
As a result, Polkadot’s current price structure may indicate the final stages of the accumulation phase, which occurs at the end of a long-term downtrend. The possibility of Wyckoff Spring presents a technically optimistic scenario; However, in order to confirm this structure, the price must rise above the resistance zones and investors should not forget this.