
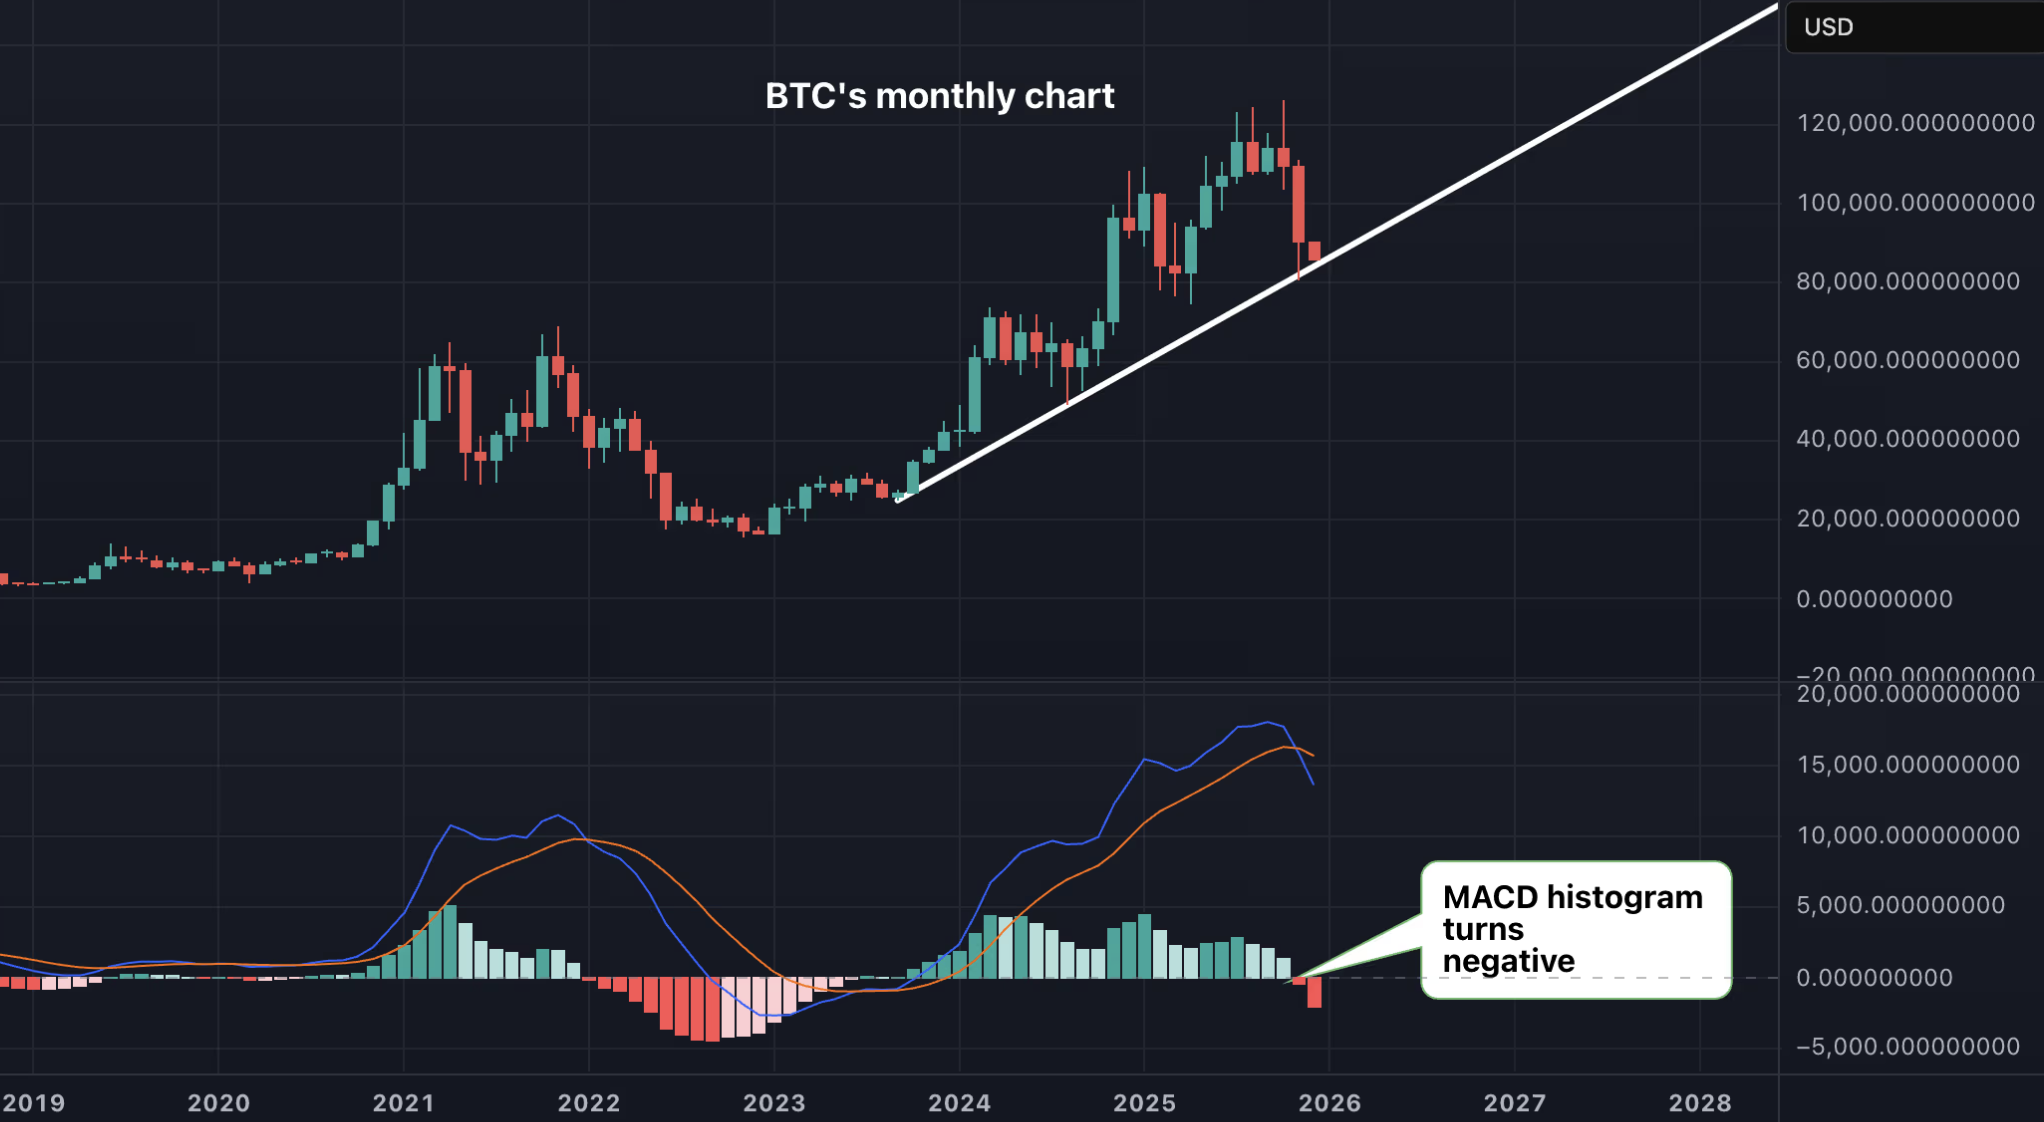
Bitcoin  $86,219.53monthly, which is one of the long-term technical indicators of MACD Histogram turned red in November. Similar signals from the indicator have been seen at the beginning of every major bear market since 2012. As the price dropped over 17 percent in November, the indicator fell below the zero line, confirming that the uptrend had been replaced by a downtrend.
Do Historical Indicators Point to a New Correction?
The MACD histogram on the monthly timeframe has turned negative in the past. BitcoinIt coincides with the moments when bull cycles end in . In the last quarter of 2021, when the price dropped from $ 70,000 to $ 50,000, a similar signal heralded a permanent decline at the beginning of 2022. The same indicator was observed in the decreases in 2018 and 2014. bear marketsIt is known that it comes into play before the deepening of the Technical analysts state that this type of bearish crossover signals are one of the most reliable momentum indicators that confirm that the price is changing direction.
However, past performance does not guarantee the future. Analysts emphasize that the signal has the potential to support the negative trend this time, due to the impact of macroeconomic risks. of japan financial pressureswatching strongly dollar index and Treasury bond yields and weakens risk appetite despite the Fed’s interest rate cut expectations. Recent outflows from spot ETFs also strengthen the bearish scenario.
Critical Technical Levels for Bitcoin
On the technical outlook, initial support is at the trend line near $84,500. If this level is broken, analysts consider $74,500 and $70,000, the 2021 peak, as possible retracement zones. Market participants warn that volatility may increase again.

On the other hand, the largest altcoin Ethereum  $2,830.62 The picture is not positive on the front either. On the technical chart, the classic “death cross” formation was confirmed when the 50-day simple moving average fell below the 200-day average. This pattern generally indicates that short-term momentum is lagging behind the long-term trend. However Ethereum marketIt is also known that, historically, these intersections do not always lead to a permanent decline.