
Sui has emerged as one of the top gainers today, fueled by bullish macro news and explosive on-chain fundamentals. As of press time, SUI is priced at $3.02, up 9.58% in the past 24 hours and nearly 13% on the week, which is an impressive gain.
Much of this enthusiasm comes from the SEC’s approval of a Grayscale ETF that includes leading assets such as BTC, ETH, SOL, XRP, and ADA. This has lifted sentiment across the Layer-1 space, including SUI. On the utility side, the Sui network hit a key milestone by processing $27.3 billion in token volume in June, signaling significant ecosystem growth and dApp usage. Intriguing enough? Join me as I decode the short-term SUI price analysis.
Sui Price Analysis:
Technically speaking, SUI is showing signs of bullish momentum, supported by surging volume and a breakout from key resistance zones. The 4-hour chart shows SUI trading above the 20-day Bollinger Band midline and holding well above the lower band.
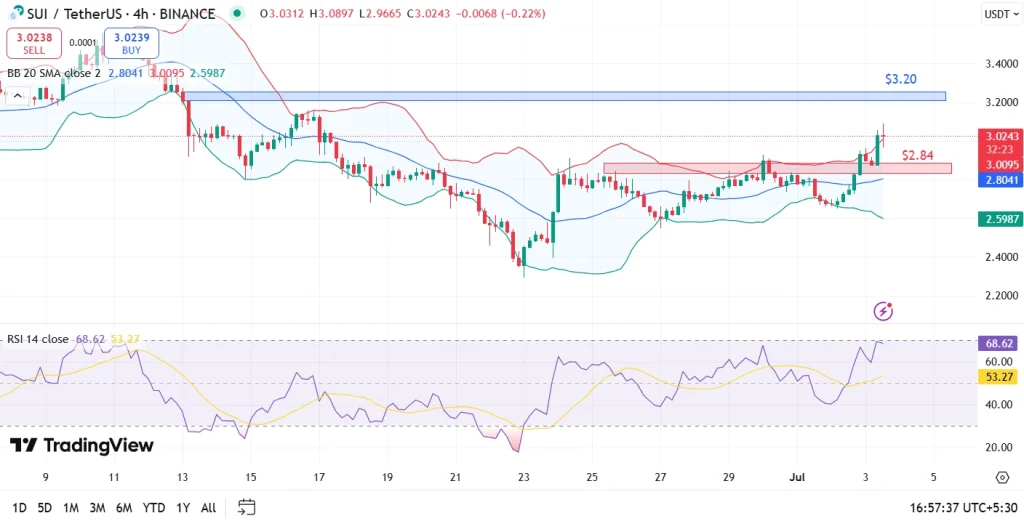
The token hit a 24-hour high of $3.08 and is now testing a critical resistance zone between $3.20 and $3.30, as marked on the chart. This area has previously rejected price advances and could act as a short-term hurdle. If bulls manage to push above this level with sustained volume, a breakout toward new local highs could follow.
On the downside, immediate support lies at $2.9847, aligning closely with the middle Bollinger Band and psychological support. Below that, $2.84 is a major support level, clearly marked on the chart, and has historically served as a strong demand zone.
Also read: Sui Price Prediction 2025, 2026-2030!
FAQs
ETF news, surging transaction volume, and strong on-chain fundamentals have all contributed to the bullish move.
The RSI at 68.6 suggests it’s nearing overbought territory, which may lead to consolidation or a minor pullback.
Resistance lies at $3.20–$3.30, support is seen at $2.9847 and $2.84 on the downside.