The Israel-Iran ceasefire announcement has breathed life into global markets, and crypto is no exception. Leading the charge today is Sei, which has emerged as the top gainer amid the rebound. With a massive 40% price spike, SEI is currently trading at $0.2851, signaling a clear breakout from its multi-week downtrend. Backed by soaring trading volume and bullish technicals, Sei appears ready to enter a new bullish phase. Join me as I decode the possible short-term Sei Price Analysis.
Sei Price Analysis
The Sei price chart on the daily timeframe presents a textbook falling wedge breakout, often considered a bullish reversal pattern. After several weeks of consolidating within this wedge, SEI broke out with high conviction, surging past its upper trendline and Bollinger band median.
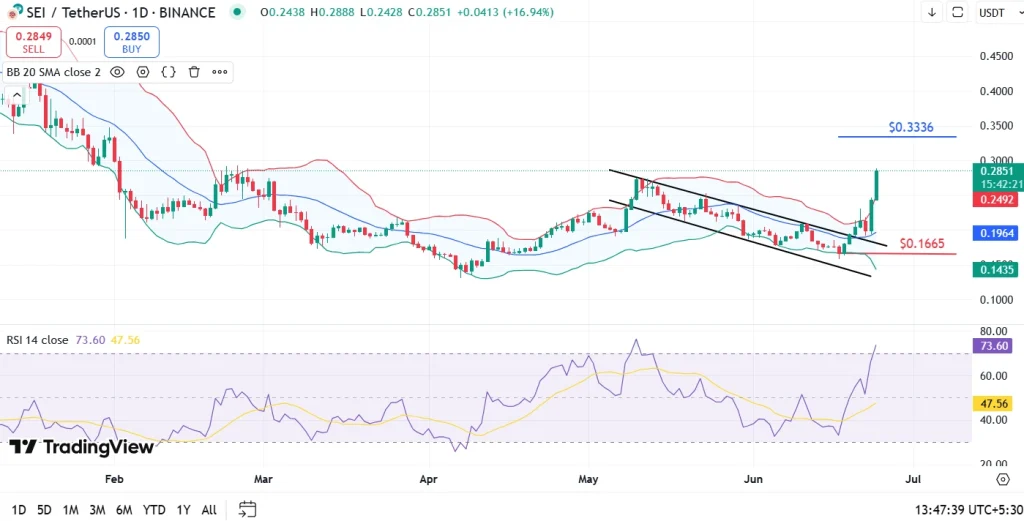
The breakout is further validated by the RSI, now at 73.60, entering overbought territory. This suggests strong buying pressure, although a short-term cool-off cannot be ruled out. The price has also moved above the 20-day Bollinger Band, another bullish signal often preceding continuation rallies.
If momentum holds, SEI’s next resistance lies near $0.3336, a previous horizontal level of interest. On the downside, support is seen at $0.1964, with critical stop-loss protection near $0.1665, the recent wedge low. The Bollinger Band expansion combined with strong volume reinforces the possibility of further upside in the short term.
Also read our Sei Price Prediction 2025, 2026-2030!
FAQs
The crypto market rebounded after the Israel-Iran ceasefire, and SEI led gains with a 40% surge.
Yes, SEI broke out of a falling wedge pattern with volume confirmation, indicating bullish momentum.
Immediate resistance lies at $0.3336. If SEI breaks that, further upside is likely in the short term.