The biggest crypto currency Bitcoin (BTC) $104,887.63 It continues to be traded in a narrow range of about 105 thousand dollars and move with low volatility. Although the price movement is limited, a powerful signal from social media sensitivity may be the catalyst of Bitcoin’s next important rise movement. Santimement’s data shows that only 1.03 percent of the comments on social media are expectation and the rate of rise/decrease has reached low levels for months. This extreme pessimism historically is an inverse signal for prices.
Excessive pessimism was detected for Bitcoin on social media
Analysis Platform Centimeter‘s real -time data measures the mood circulating in the crypto currency market. The latest data revealed that the ratio of rising comments is only 1.03 percent. This decrease points to one of the lowest rise/decrease expectation rates recorded for months compared to the interpretations.
A similar wave of extreme pessimism was observed in the global markets on April 6 during the artam tension. At that time, this extreme fear (Fud) was a harbinger of a local bottom point for the price of Bitcoin, and then an important rise began. Past data among individual investors FudIt supports that it is often an inverse indicator of its predominance.
The fact that investors start to give up emotionally means that most of their panic sales are already realized or are about to be completed. This psychological factor coincides with the current technical picture. This deep pessimism on social media may indicate a potential purchase opportunity.
What do the technical indicators say? Critical Price Levels in Bitcoin Chart
Bitcoin, $ 90 thousand dollars after a rapid exit over 100 thousand dollars entered a consolidation period entered. The current price movement seems to be a healthy recovery phase before the next important move instead of a structural deterioration. The upward tendency of long -term moving averages and the preservation of support levels indicate that the wide picture is still rising.
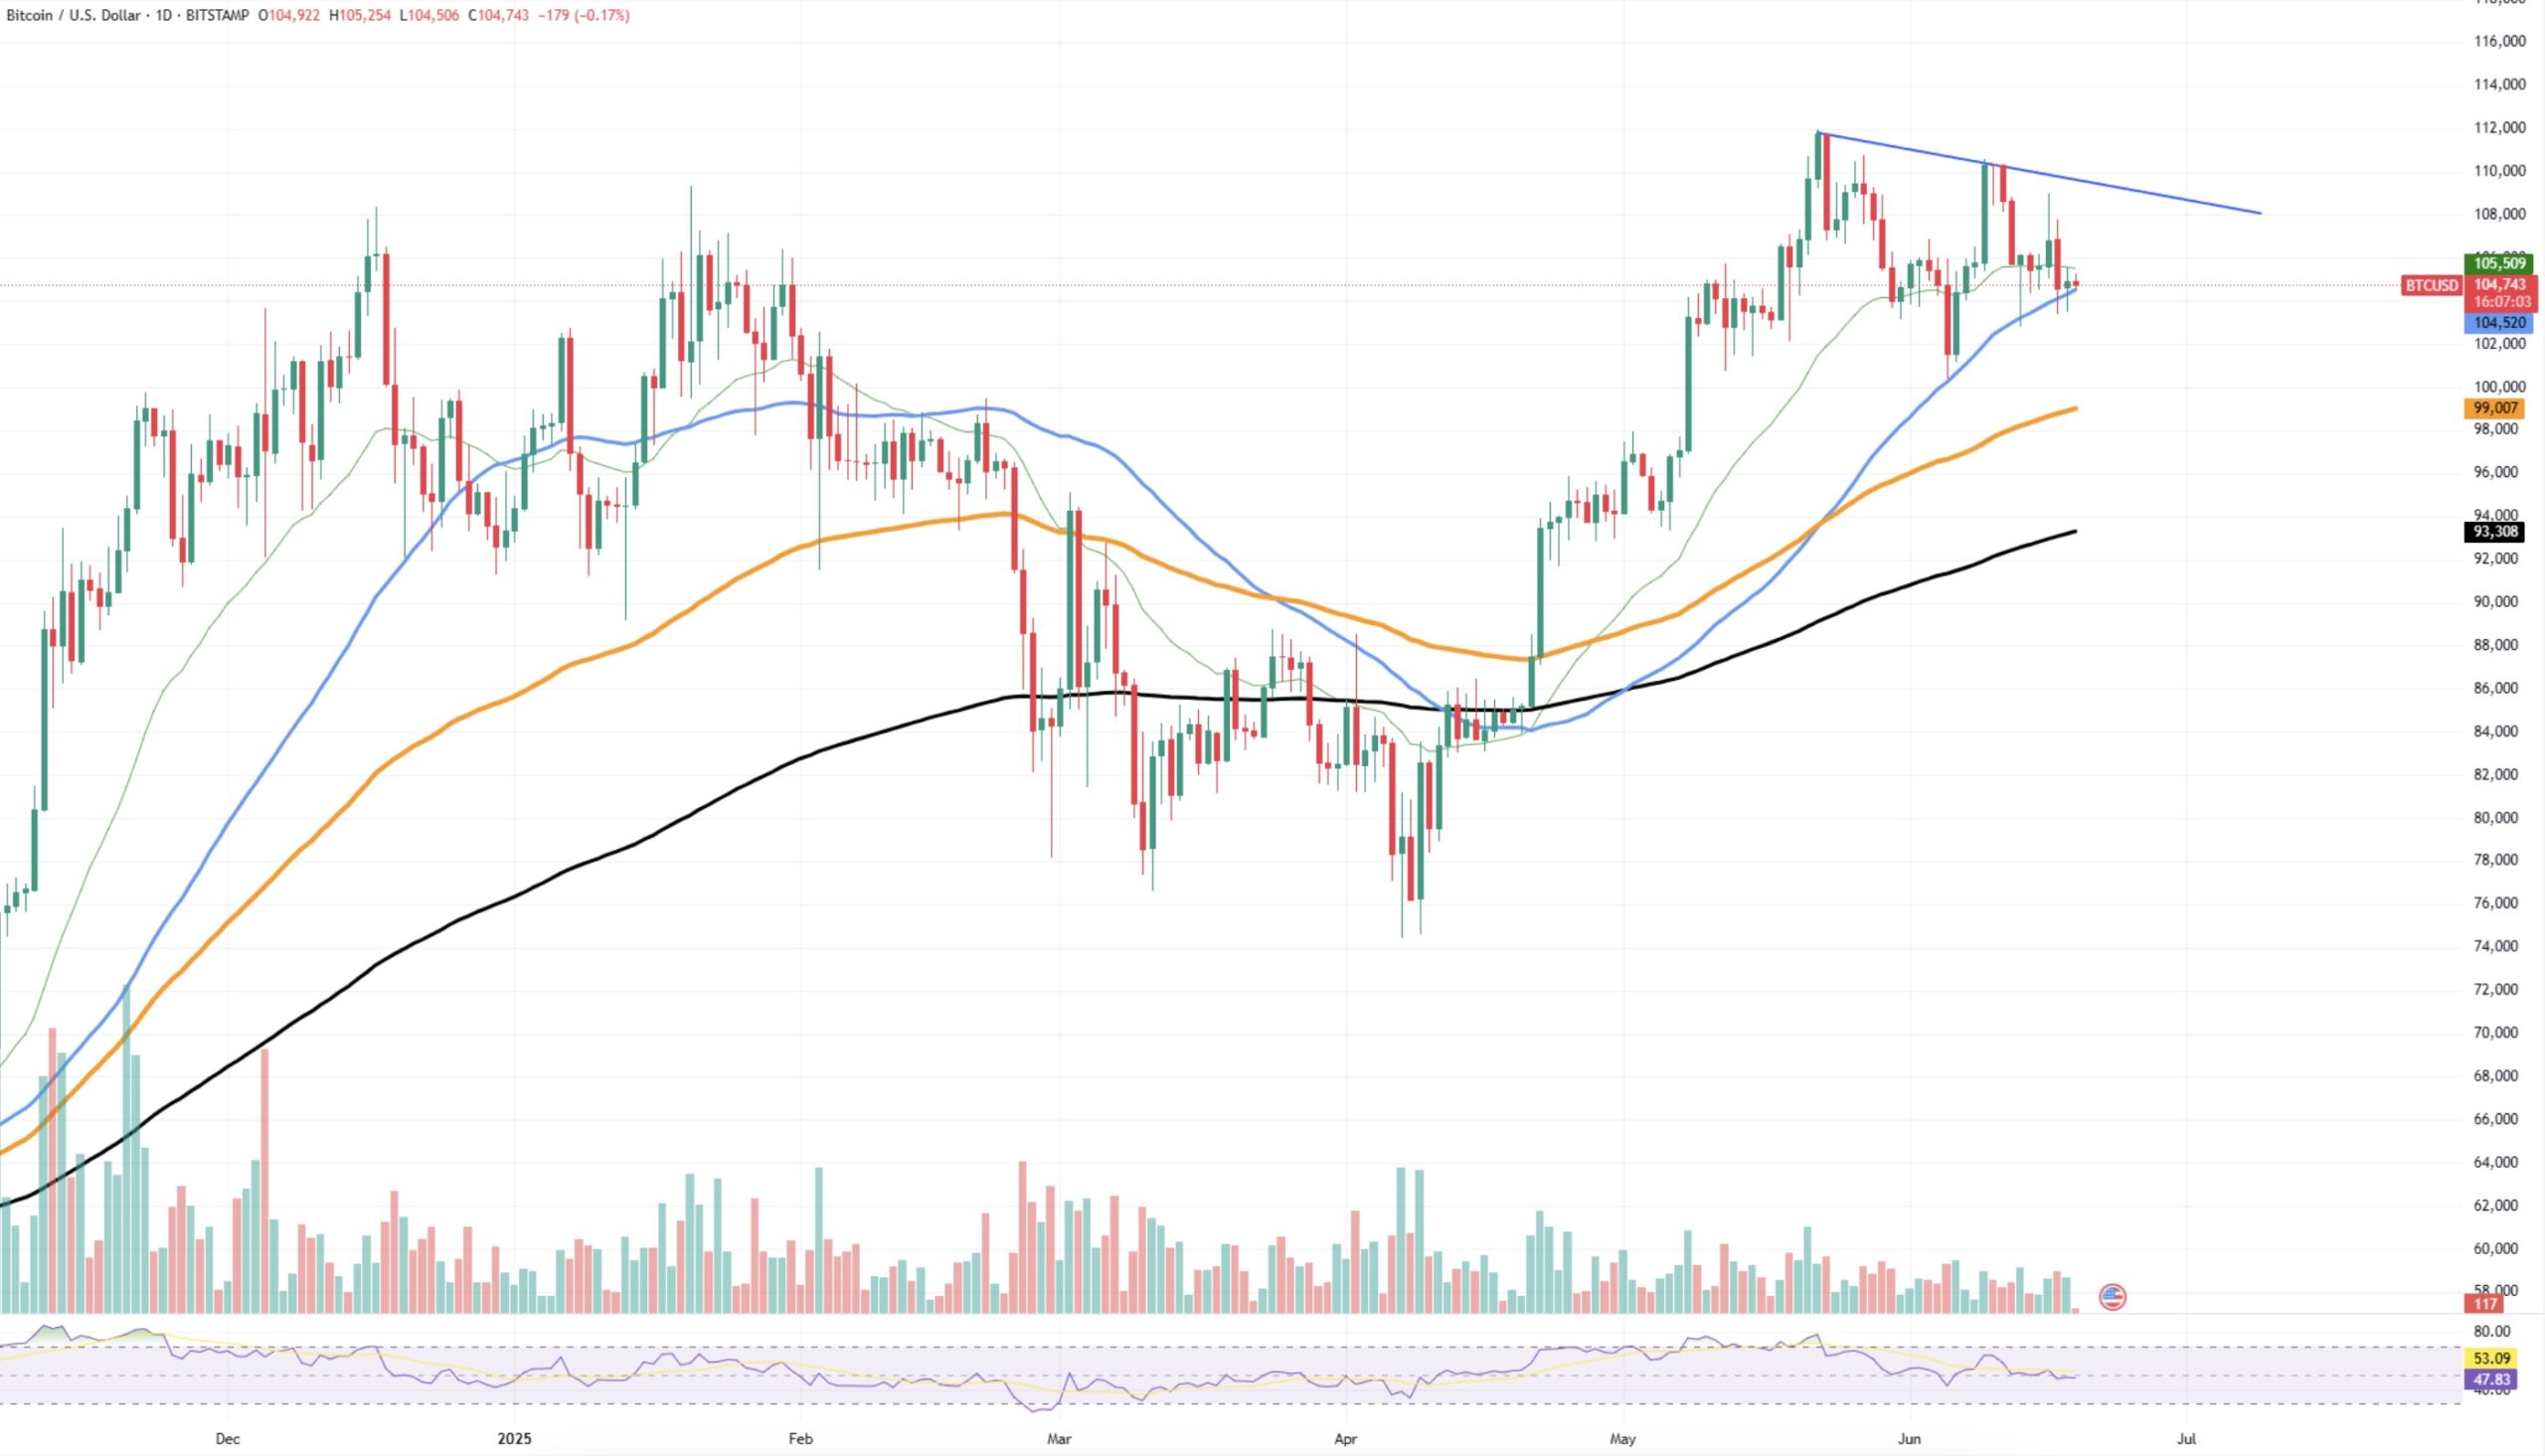
Price is a classic formation in technical analysis 26 days Exponential moving average (EMA) and a downward resistor moves in a triangle stuck between the trend line. This compression gives weak signals of an upcoming volatility explosion. Although the structure may seem strong, there are critical levels to be followed carefully.
Experts say that a permanent breakdown above 108 thousand dollars should be closely monitored for a new rise in which the previous hills were targeted. On the other hand, the downward breaking of the important set of support in the range of 102 thousand – 104 thousand dollars may increase the risk of short -term decrease. However, the fact that the basic indicators are strong and the sensitivity to the bottom levels shows that the opposite signal is clear. This brings to mind that Bitcoin may be preparing for the next strong rise.
Responsibility Rejection: The information contained in this article does not contain investment advice. Investors should be aware that crypto currencies carry high volatility and thus risk and carry out their operations in line with their own research.