
Gold price While we continue to make peaks before FOMC, we continue to see red candles in crypto currencies. BTC is below $ 94 thousand and the subcoins continue to be slow but stable. So what do the current estimates of technical analysis experts say to us? What are the investors expect?
Crypto Coins Technical Analysis
Efloud has released one of the market updates that he hasn’t shared for a long time. The well -known analyst is closely monitored due to its comprehensive evaluations. The total market value of crypto currencies is the total2 graph that represents smaller subcoins and Bitcoin $94,016.88 With the market domination graph, he discussed the current situation of Altcoins on the technical front.
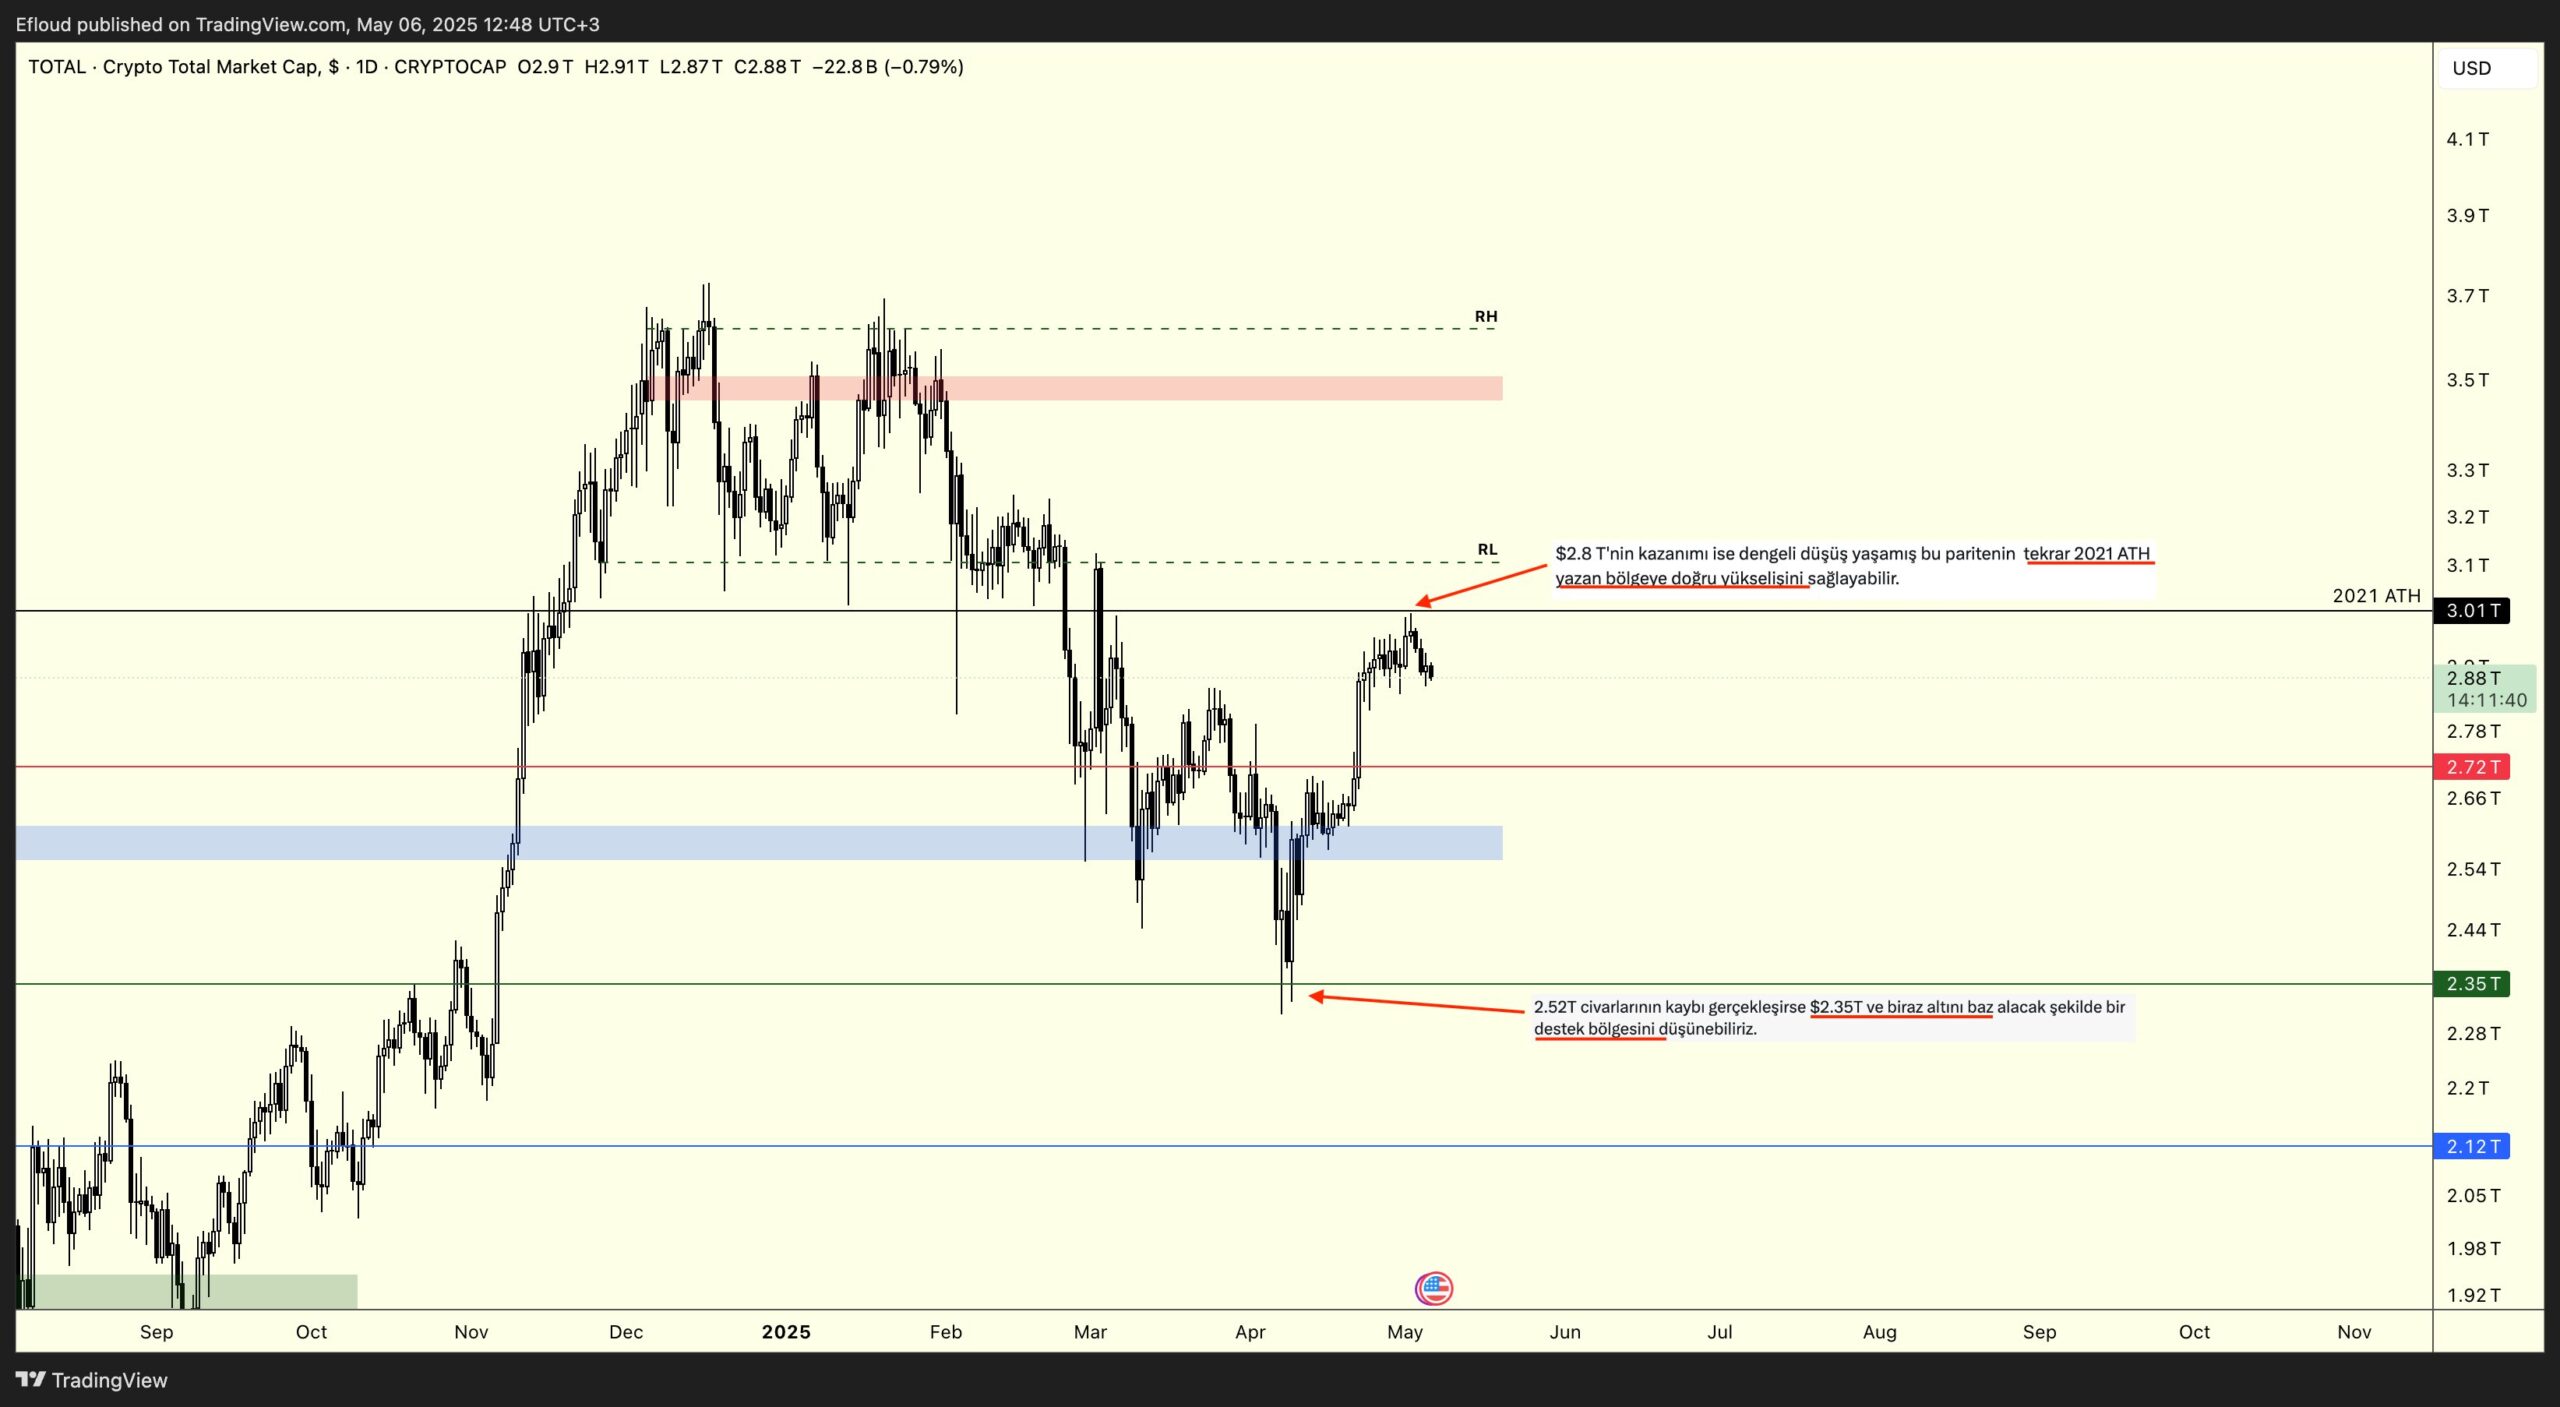
Totalcap The graph says that the support of the ACC level of 2021 as follows will be the first strong rise signal. With the acquisition of the RL level, the short -term rise is waiting to come. However, as we will see from the rise of gold, withdrawal to 2.78 and 2.67 trillion dollars can be seen here if the uncertainty is strengthened. Both levels are hoped to remain strong in support. In the test of 2.67 trillion dollars, he underlined that he could make purchases according to the conditions.
Total2 graph has caused the analyst to sell sales due to the response in the resistance. Analyst said that he sold subcoins such as ENA, DEGE and LINK in this field;
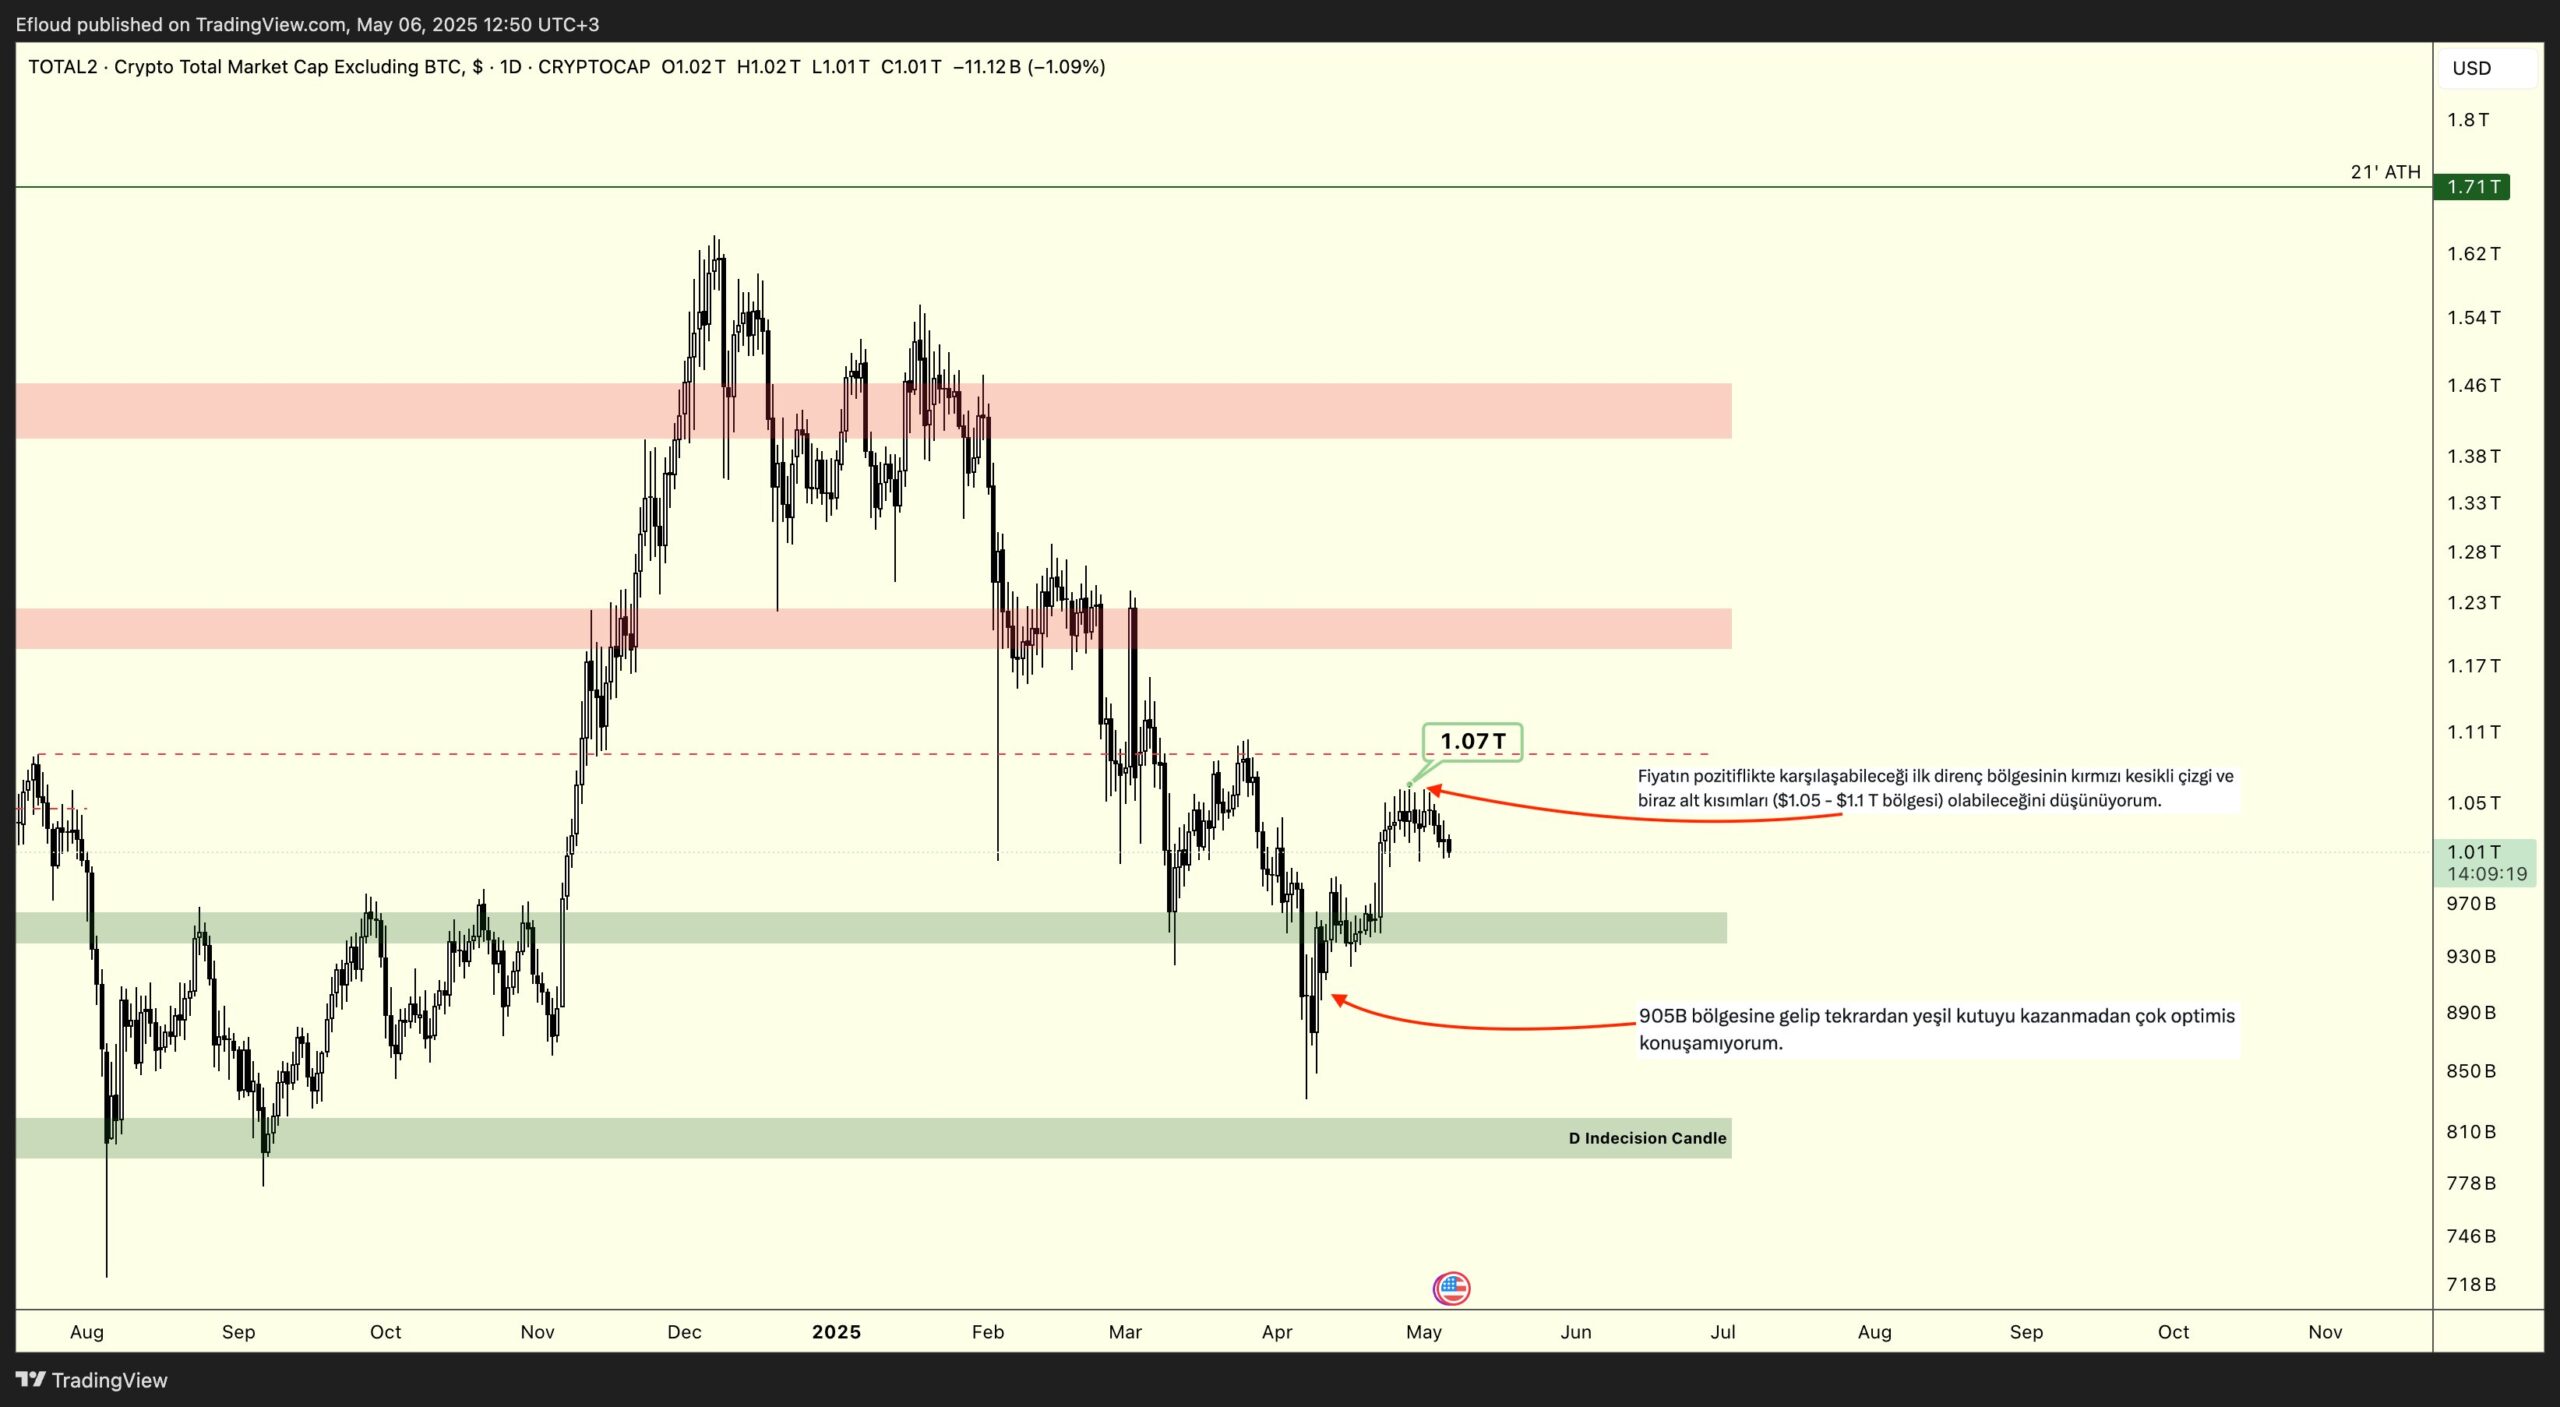
“The lower part of the green box is the place where I can search for support if the correction continues and I can buy it if I see approval.
If there is no correction, simultaneously with the earnings of the red -cut line, I will consult with $ ETHBTC in a caution. ”
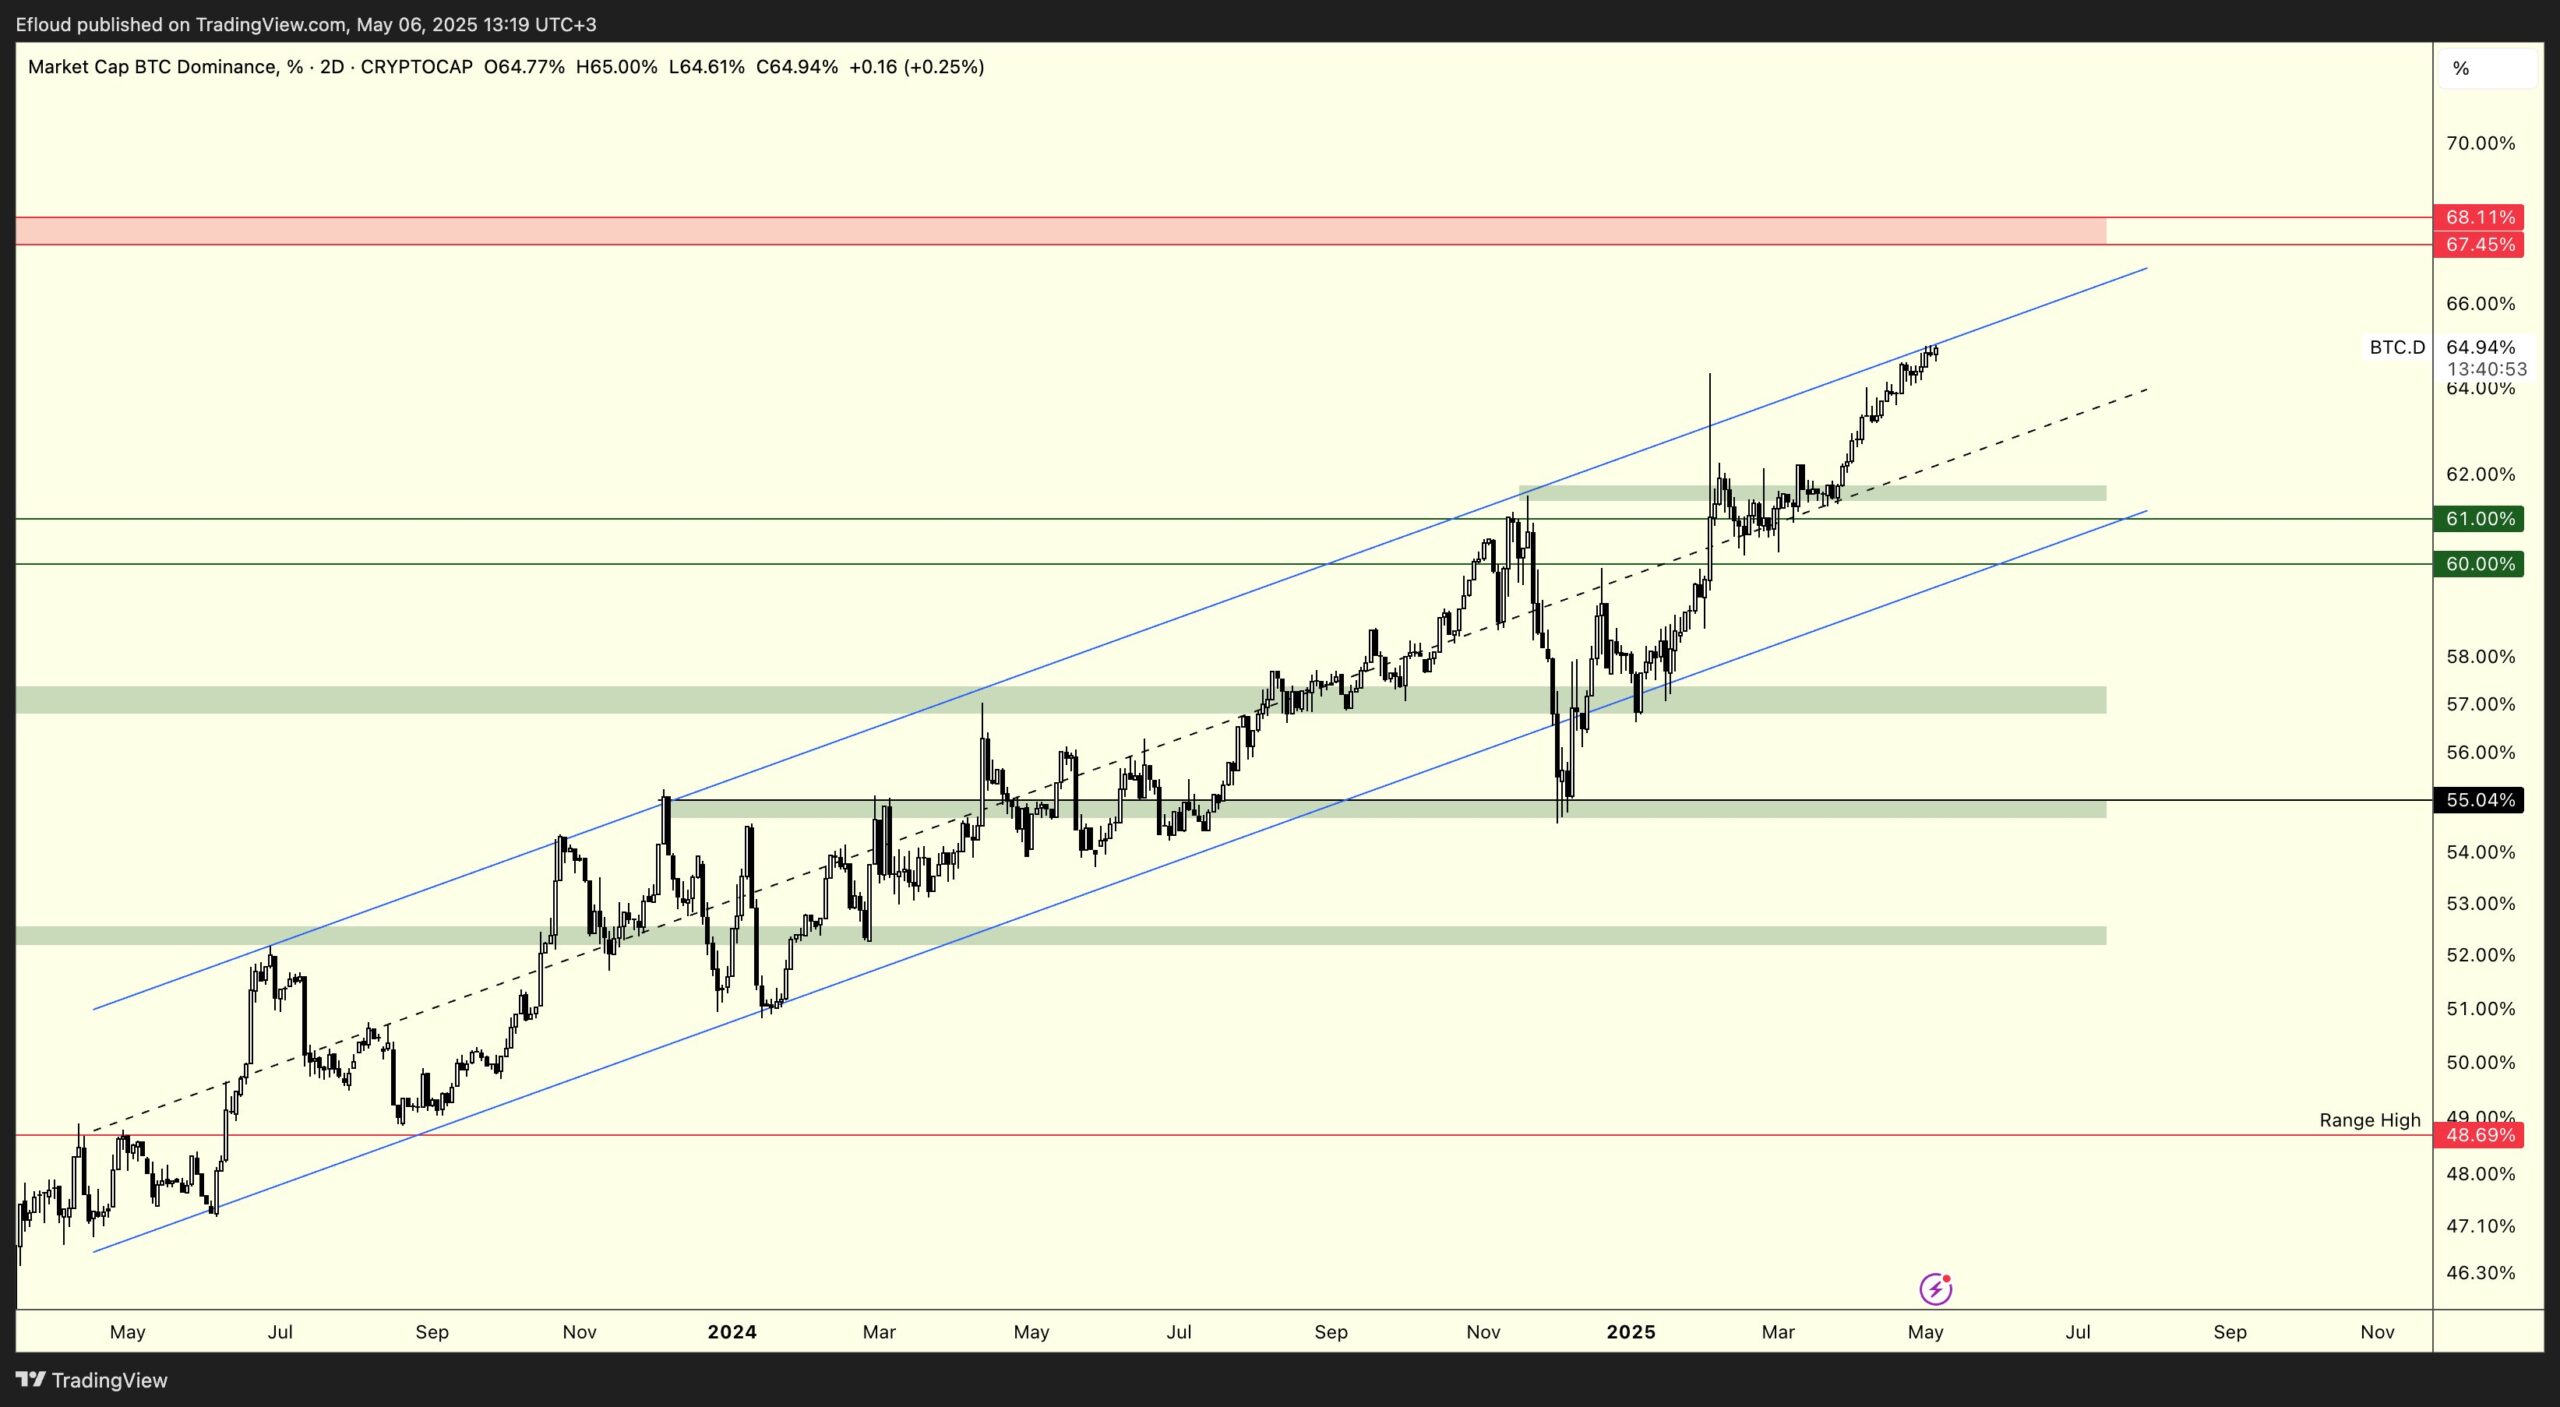
And of course finally Bitcoin Market domination graph. This graph is an important sign for the bull of Altcoin, because during the periods of Altcoin bulls, BTCD rapidly weakens new bottoms while subcoins make new peaks.
“The raid rate unfortunately continues to increase. The upward breaking of the channel will drag the price towards the red box. I will look for LTF approval signs in that region. I will not think of trading without approval because the dominance looks serious.
Bitcoin rise historical data
Noach is among the analysts looking for an upward signal. It draws attention to the model that emerged from the beginning of 2024 and rally at the end of 2024. During this period, short -term BTC investors (for 1 day to 1 week BTC He was active just before the big price movements.
Analyst now says that there is the same mobility.
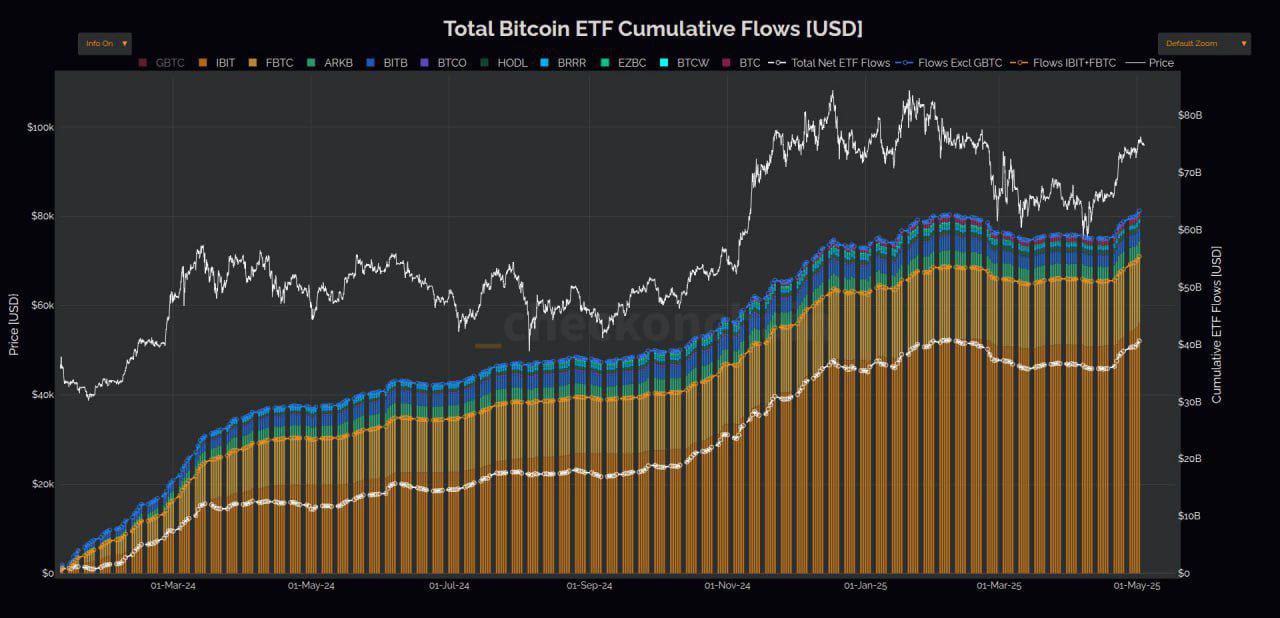
“And here is another statistics: Bitcoin ETF inputs reached the highest level of all time – $ 40,62 billion.
These silent accumulation stages are usually places where smart money is loaded. Could this be a silence before this 100 thousand dollars break? Something that should be taken into consideration. “
Responsibility Rejection: The information contained in this article does not contain investment advice. Investors should be aware that crypto currencies carry high volatility and thus risk and carry out their operations in line with their own research.