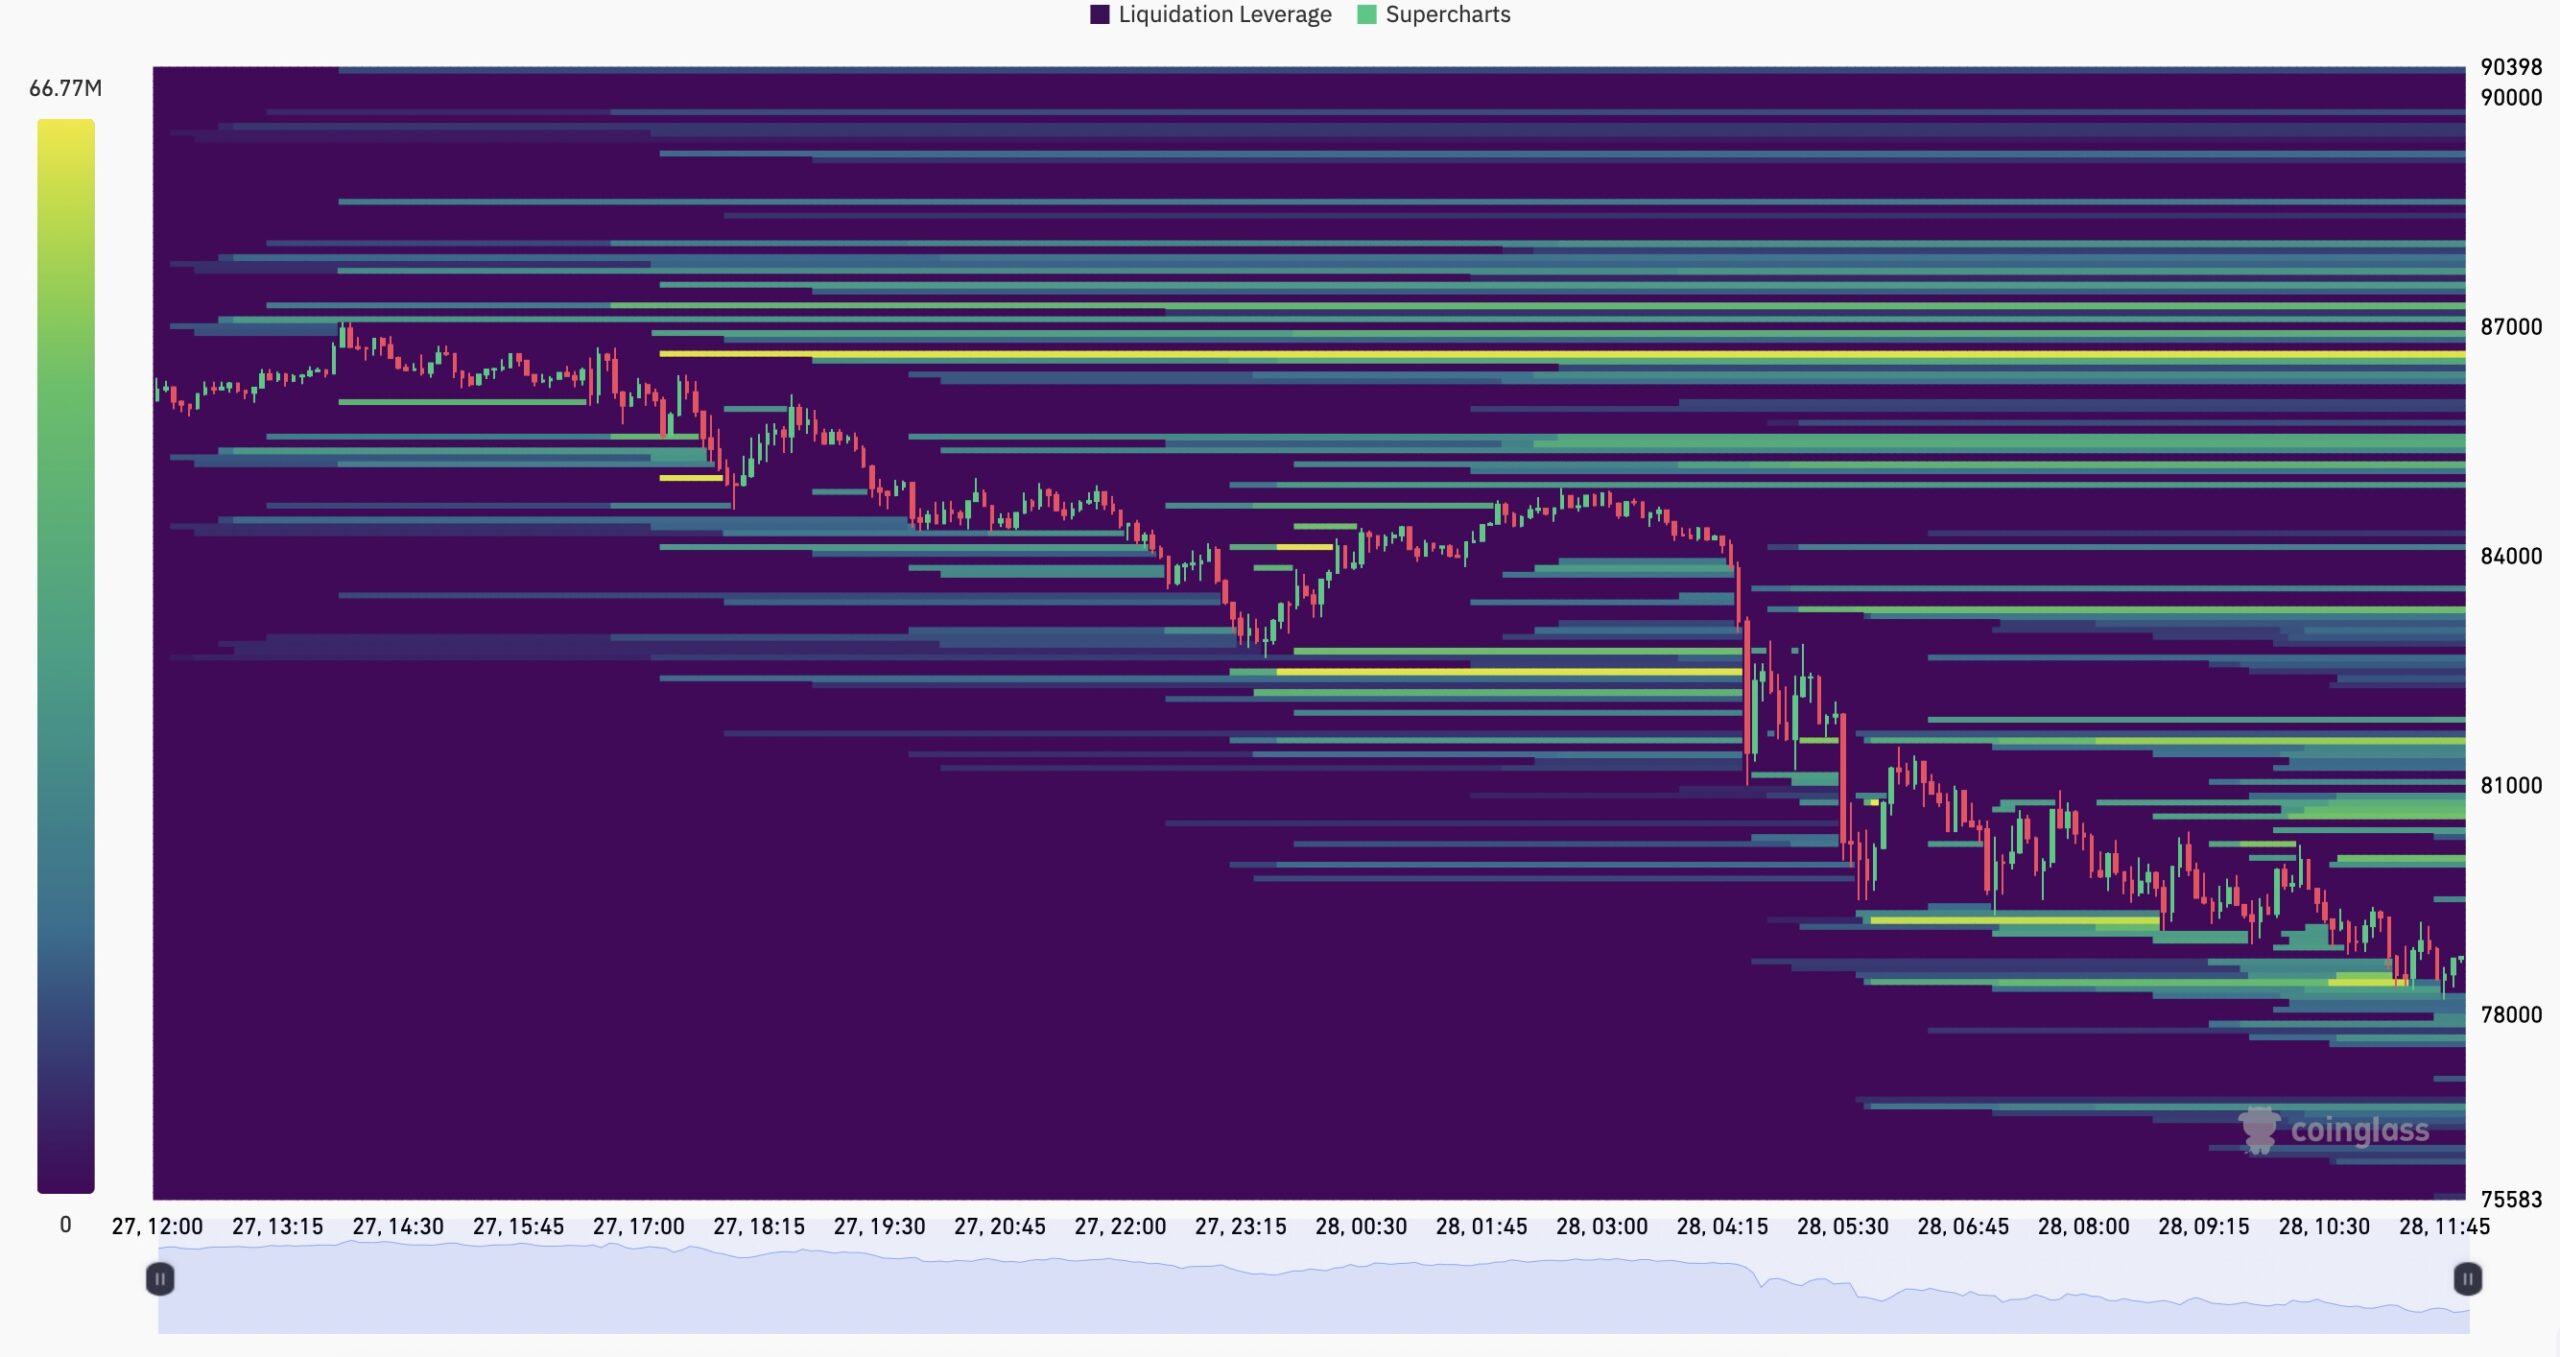
Bitcoin (BTC) $79,984.07 While the price decreases, the liquidation data in the giant crypto currency exchange Binance attracts attention. In the last 24 hours, large -scale liquidations took place in the BTC/USDT parity. The heat map provided by CoNSS reveals the intensity of critical liquidation levels for the largest crypto currency. Bitcoin priceThe downward mobility in it has made it difficult for investors using high leverage.
What does Bitcoin’s liquidation map tell?
Binance’s BTC/USDT The liquidation heat map of the parity shows that price movements face intensive liquidations at critical levels. The most striking point on the map is the liquidation levels that concentrate on the 80 thousand – 87 thousand dollars. Large sales waves led to the closure of long positions in this region. This once again revealed the risks of investors’ excessive leverage.

Liquidations, which continued to 78 thousand dollars with the downward price movement, increased sales pressure in the market. The liquidation levels of large funds and futures traders become an important factor in determining the short -term aspect of Bitcoin. The fact that investors follow the liquidation zones is critical to protect their positions.
On a single screen instant prices, important data, news, latest developments, comments and discussions at Chat! Come right away from your eyes!
What are the critical levels for Bitcoin price?
Within the last 24 hours Bitcoin price It fell from 90 thousand dollars to 78 thousand dollars. Increased liquidations below $ 80 thousand indicates that the price can move even downwards. Technical indicators show that Bitcoin can test $ 75,000 in the short term. For the rise, it is critical to exceed 81 thousand 500 – 83 thousand dollars.
The general trend in the market reveals that volatility has increased due to the effect of leveraged processes. Large investors and market makers play an active role at these levels. It is recommended that investors determine stop-Loss strategies and use leverage rates in a controlled manner. Huge losses may be inevitable if it is not careful in leveraged procedures.
What is Bitcoin Liquidation Map?
Bitcoin Liquidation Mapis an indicator showing areas where large liquidations are possible at certain price levels. The leveraged transactions can be closed by the stock exchanges by the stock exchanges by falling to a certain level of an investor’s guarantee.
It is calculated based on liquidation levels, market data and leverage rates. On the map, the colors concentrating from purple to yellow indicate intense liquidation points. Yellow areas indicate the points where the price is the highest probability of moving with the wave of liquidation.
Investors can predict how price movements can turn to intense liquidation areas using the BTC/USDT liquidation map. When the big orders are entered in these areas, the price either makes a hard movement or the direction can reversal.
Responsibility Rejection: The information contained in this article does not contain investment advice. Investors should be aware that crypto currencies carry high volatility and thus risk and carry out their operations in line with their own research.


