
Enter the realm of Bitcoin ETFs, a burgeoning trend that recently gained significant momentum.
The monthly analysis, which delves deep into the performance of both Bitcoin Futures ETS and Spot ETFs, aims to provide invaluable insights for all, including newcomers. This dissects key metrics including one-month average volume, expense ratio, one-month return, and net fund flow. But that is not all – this exploration goes beyond the numbers, offering an in-depth technical analysis to unveil hidden insights.
Get ready to gain a deeper understanding of the ETF landscape.
1. Bitcoin Futures ETF In-Depth Analysis
At the time of performing this analysis, BITO, XBTF, BTF, BITS, ARKA, DEFI, BITC, BETH, BETE, and ARKC are the prominent ETFs in the Bitcoin Futures ETF market.
| Bitcoin Futures ETF | AUM |
| BITO | $598.78M |
| XBTF | $42.41M |
| BTF | $38.20M |
| BITS | $26.10M |
| ARKA | $8.01M |
| DEFI | $5.00M |
| BITC | $4.55M |
| BETH | $4.43M |
| BETE | $2.45M |
| ARKC | $1.20M |
Among them, BITO, XBTF, BTF, BITS, and ARKA are the top five Bitcoin Futures ETFs, on the basis of Asset Under Management.
BITO has the highest AUM of $598.78M. XBTF and BTF follow with $42.41M and $38.20M, respectively.
Let’s analyse the top five Bitcoin Futures ETFs deeply using various parameters.
1.1. Bitcoin Futures ETF: A Basic Data Overview
This basic data overview gives an overall picture of the top player’s performance.
| Bitcoin Futures ETF | Price | Price Change | Volume | 1 Month Average Volume | 3 Month Average Volume | AUM | Shares |
| BITO | $27.28 | -2.12% | 10,617,900 | 8,242,195 | 16,158,040 | $598.78M | 78.6M |
| XBTF | 51,752 | 40,445 | $42.41M | 1.1M | |||
| BTF | $21.07 | -0.61% | 18,200 | 36,191 | 55,469 | $38.20M | 2.7M |
| BITS | $66.37 | -2.45% | 2,600 | 3,091 | 8,556 | $26.10M | 0.4M |
| ARKA | $64.38 | -1.34% | 100 | 2,668 | 5,002 | $8.01M | 0.3M |
Let’s go beyond what the basic data communicates.
1.2. Bitcoin Futures ETF Monthly Average Volume Analysis
| Bitcoin Futures ETF | 1 Month Average Volume | 3 Month Average Volume |
| BITO | 8,242,195 | 16,158,040 |
| XBTF | 51,752 | 40,445 |
| BTF | 36,191 | 55,469 |
| BITS | 3,091 | 8,556 |
| ARKA | 2,668 | 5,002 |
Among the top Bitcoin Futures ETFs, BITO has the highest one-month average volume of 8,242,195. XBTF and BTF follow with 51,752 and 36,191, respectively. BITO also marks the highest three-month average volume of 16,158,040. BTF and XBTF follow with 55,469 and 40,445, respectively. Interestingly, XBTF’s one-month average volume is higher than its three-month average volume, unlike other ETFs.
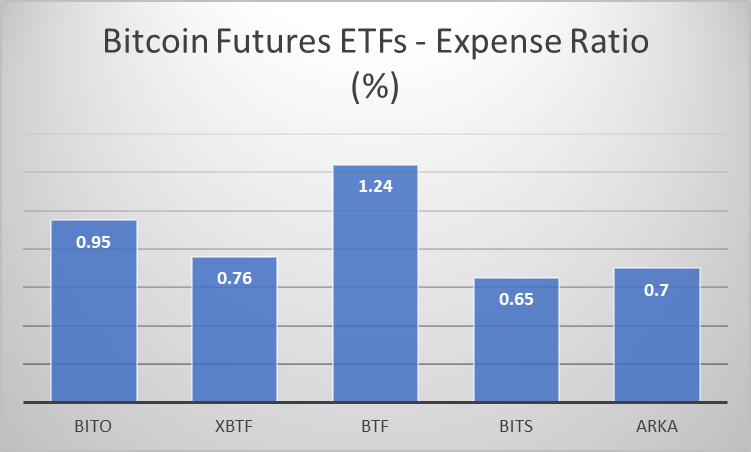
1.3. Bitcoin Futures ETF Expense Ratio Analysis
The data below compares the cost efficiency of a Bitcoin Futures ETF to that of its peers.
| Bitcoin Futures ETF | Expense Ratio (in %) |
| BITO | 0.95% |
| XBTF | 0.76% |
| BTF | 1.24% |
| BITS | 0.65% |
| ARKA | 0.70% |
Among the top Bitcoin Futures ETFs, BITS shows the smallest expense ratio of 0.65%. ARKA and XBTF follow with 0.70% and 0.76%, respectively. BITO registers a 0.95% expense ratio, and BTF 1.24%.
1.4. Bitcoin Futures ETF Performance Analysis
This data shows how a Bitcoin Futures ETF has performed relative to its peers this month.
| Bitcoin Futures ETF | 1 Month Return (in %) | 3 Month Return (in %) |
| BITO | 8.81% | 11.45% |
| XBTF | -0.83% | 20.42% |
| BTF | 13.73% | 12.18% |
| BITS | 8.19% | 0.38% |
| ARKA | 8.48% | 10.84% |
Among the top Bitcoin Futures ETFs, BTF registers the highest one-month return of 13.73%. BITO, ARKA, and BITS are followed by 8.81%, 8.48%, and 8.19%, respectively. XBTF reports the lowest return of -0.83%. Meanwhile, XBTF displays the highest three-month return of 20.42%. BTF, BITO, and ARKA are followed by 12.18%, 11.45%, and 10.48%, respectively. BITS has the lowest three-month return of 0.38%. Notably, the three-month return values of BITO, XBTF and ARKA are higher than its one-month return. The opposite is the case for BTF and BITS.
1.5. Bitcoin Futures ETF One Month Net Fund Flow Analysis
| Bitcoin Futures ETF | One Month Net Fund Flow |
| BITO | -127.18M |
| XBTF | -11.49M |
| BTF | -1.37M |
| BITS | -2.04K |
| ARKA | N/A |
Among the Bitcoin Futures ETFs, none of them has a positive one-month net fund follow. The BITO reports the highest one-month negative net fund flow of -127.18M. XBTF, BITS and BTF follow with -11.49M, -2.04M, and -1.37M, respectively.
1.6. Bitcoin Futures ETF Technical Analysis
| Bitcoin Futures ETF | Williams % Range (20 Days) | MACD (15 Period) | 20 Day Moving Average | RSI (30 Days) | 20 Day Volatility | Price |
| BITO | 20.60 | 0.93 | $26.50 | 55 | 47.18% | $27.28 |
| XBTF | 50.58 | 0.54 | $39.19 | 54 | 42.50% | N/A |
| BTF | 13.94 | 1.49 | $19.29 | 58 | 45.02% | $21.07 |
| BITS | 22.43 | 2.57 | $64.64 | 54 | 50.44% | $66.37 |
| ARKA | 20.83 | 1.94 | $62.28 | 55 | 45.79% | $64.38 |
The technical analysis of BITO, XBTF, BTF, BITS and ARKA using Williams % Range, MACD, RSI, and 20-day volatility reveals varied short-term momentum and volatility levels. BITO and ARKA exhibit similar mid-range Williams % values around 20, indicating less overbought/oversold conditions compared to XBTF and BITS. MACD values suggest BITS (2.57) and ARKA (1.94) have stronger bullish momentum. RSI values are moderate for all ETFs, hovering around 54-58, indicating neutral strength. Volatility is highest in BITS (50.44%) and lowest in XBTF (42.50%). In conclusion, BITS shows the highest volatility and bullish momentum, while XBTF appears less volatile and neutral in momentum, making it potentially more stable.
2. Bitcoin Spot ETF In-Depth Analysis
At the time of doing this analysis, GBTC, IBIT, FBTC, ARKB, BITB, HODL, BRRR, BTCO, EZBC, and BTCW are the prominent players in the Bitcoin Spot ETF market.
| Bitcoin Spot ETF | AUM |
| GBTC | $24.33B |
| IBIT | $17.24B |
| FBTC | $9.90B |
| ARKB | $2.85B |
| BITB | $2.16B |
| HODL | $529.70M |
| BRRR | $501.80M |
| BTCO | $383.40M |
| EZBC | $312.00M |
| BTCW | $79.70M |
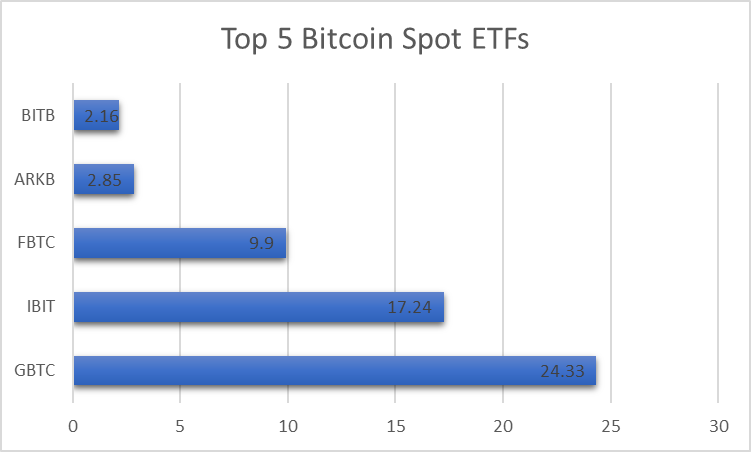
Among them, GBTC, IBIT, FBTC, ARKB, and BITB are among the top five Bitcoin Spot ETFs based on Asset Under Management.
GBTC has the highest AUM of $24.33B. IBIT closely follows with $17.24B AUM. FBTC and ARKB register $9.9B and 2.85B AUM, respectively.
Let’s analyse these top Bitcoin Spot ETFs using various parameters.
2.1. Bitcoin Spot ETF: A Basic Data Overview
This basic data overview offers an overall picture of the top EFT’s performance.
| Bitcoin Spot ETF | Price | Price Change | Volume | 1 Month Average Volume | 3 Month Average Volume | Shares | AUM |
| GBTC | $60.09 | -1.56% | 5,600,200 | 6,176,559 | 13,193,675 | 322.8M | $24.33B |
| IBIT | $38.55 | -1.56% | 23,144,600 | 24,773,432 | 40,401,928 | 507.6M | $17.24B |
| FBTC | $59.11 | -1.73% | 4,651,800 | 6,225,364 | 10,717,169 | 185.6M | $9.90B |
| ARKB | $67.55 | -1.75% | 1,767,800 | 1,401,459 | 2,464,778 | 48.7M | $2.85B |
| BITB | $36.85 | -1.65% | 2,201,500 | 1,883,873 | 2,719,837 | 66.8M | $2.16B |
Let’s go beyond what the basic data conveys.
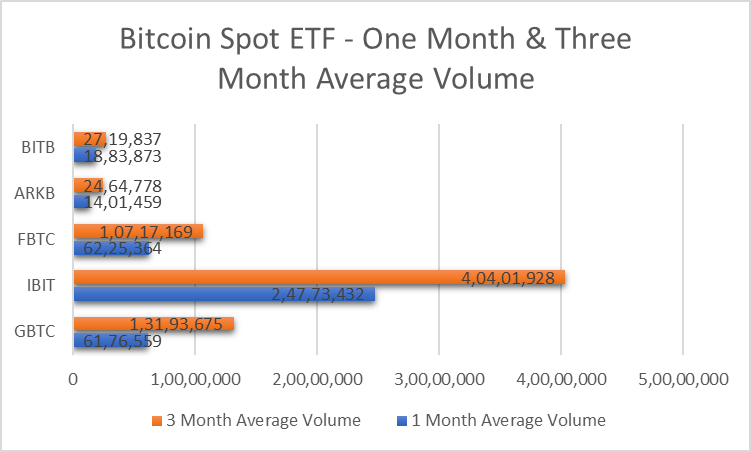
2.2. Bitcoin Spot ETF Average Volume Analysis
| Bitcoin Spot ETF | 1 Month Average Volume | 3 Month Average Volume |
| GBTC | 6,176,559 | 13,193,675 |
| IBIT | 24,773,432 | 40,401,928 |
| FBTC | 6,225,364 | 10,717,169 |
| ARKB | 1,401,459 | 2,464,778 |
| BITB | 1,883,873 | 2,719,837 |
Among the top Bitcoin Spot ETFs, IBIT has the highest one-month average volume of 24,773,432. FBTC and GBTC closely follow with 6,225,364 and 6,176,559 average volume, respectively. Meanwhile, the highest three-month average volume is reported by IBIT (40,401,928 average volume). GBTC and FBTC follow with 13,193,675 and 10,717,169 average volume, respectively. In all the five ETFs, the three-month average volume is higher than the one-month average volume.
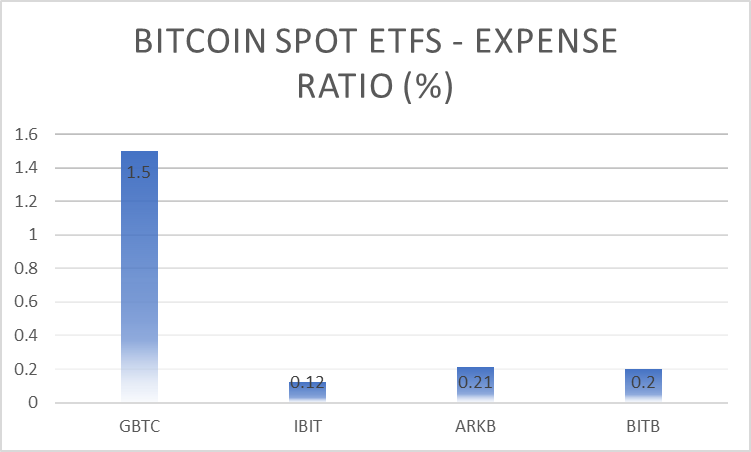
2.3. Bitcoin Spot ETF Expense Ratio Analysis
The data below compares the cost efficiency of a Bitcoin Spot ETF to its peers.
| Bitcoin Spot ETF | Expense Ratio (in %) |
| GBTC | 1.50% |
| IBIT | 0.12% |
| FBTC | N/A |
| ARKB | 0.21% |
| BITB | 0.20% |
Among the top Bitcoin Spot ETFs, IBIT has the smallest expense ratio of 0.12%. BITB and ARKB follow with 0.20% and 0.21%, respectively. GBTC has the highest expense ratio of 1.50%.
2.4. Bitcoin Spot ETF Performance Analysis
This data shows how a Bitcoin Spot ETF has performed relative to its peers this month.
| Bitcoin Spot ETF | One Month Return | Three Month Return |
| GBTC | 8.88% | 13.39% |
| IBIT | 9.17% | 13.67% |
| FBTC | 9.20% | 13.83% |
| ARKB | 9.18% | 13.64% |
| BITB | 9.11% | 13.65% |
Among the top Bitcoin Spot ETFs, FBTC registers the highest one-month return of 9.20%. ARKB, IBIT and BITB follow with 9.18%, 9.17% and 9.11%, respectively. GBTC marks the lowest one-month return of 8.88%. Meanwhile, all the five top ETFs show a value slightly above 13% in terms of three-month return. The highest three-month return is shown by FBTC (13.83%) itself. Likewise, the lowest is reported by GBTC (13.39%).
2.5. Bitcoin Spot ETF Net Fund Flow Analysis
| Bitcoin Spot ETF | 1 Month Net Fund Flow |
| GBTC | -592.6M |
| IBIT | +1000M |
| FBTC | +540.42M |
| ARKB | +328.11M |
| BITB | +164.67M |
Among the top Bitcoin Spot ETFs, only one ETF shows a negative one-month net fund flow; GBTC reports a -592.6M net fund flow. IBIT records the highest one-month net fund flow of +1B. FBTC, ARKB, and BITB follow with +540.42M, +328.11M and +164.67M.
2.6. Bitcoin Spot ETF Technical Analysis
| Bitcoin Spot ETF | Williams % Range (20 Days) | MACD (15 Period) | 20 Day Moving Average | RSI (30 Days) | 20 Day Volatility | Price |
| GBTC | 20.74 | 1.99 | $58.08 | 55 | 46.28% | $60.09 |
| IBIT | 20.11 | 1.32 | $37.21 | 55 | 46.45% | $38.55 |
| FBTC | 19.81 | 2.04 | $57.14 | 55 | 47.19% | $59.11 |
| ARKB | 19.60 | 2.34 | $65.31 | 55 | 46.54% | $67.55 |
| BITB | 19.97 | 1.26 | $35.60 | 55 | 46.37% | $36.85 |
The technical analysis of GBTC, IBIT, FBTC, ARKB, and BITB shows closely aligned indicators. The Williams % Range indicates all ETFs are near the overbought threshold, with values around 20, suggesting limited upside. MACD values indicate ARKB (2.34), and FBTC (2.04) have the strongest bullish momentum. The RSI is uniformly neutral at 55 for all ETFs, implying balanced buying and selling pressure. Volatility is similar across the ETFs, ranging from 46.28% to 47.19%, indicating consistent market risk. In summation, ARKB and FBTC exhibit stronger bullish momentum, while all ETFs show uniform RSI and volatility, indicating similar stability and market sentiment.
Endnote
As we conclude our monthly analysis of Bitcoin ETFs, we unveil a tapestry of insights into both Bitcoin futures ETFs and Spot ETFs. Through meticulous examination of parameters like one-month average volume, expense ratio, one-month return, and net fund flow, we have illuminated the performance dynamics within these ETFs. Furthermore, our in-depth technical analysis has revealed hidden patterns and trends, providing a deeper understanding of market movements. As Bitcoin ETFs continue to shape the investment landscape, may this analysis serve as a beacon of guidance for investors, empowering them to navigate the complexities of ETF markets with confidence and clarity.