


The post Daily Market Analysis: BTC, ETH, AKT, FET, AGIX. appeared first on Coinpedia Fintech News
Bulls take back control of today’s crypto market, with a growth of 0.12 % in the last 24 hours. The global crypto market stands at $2.26 trillion with BTC still under $62K with 52% market dominance.
Bitcoin (BTC) Analysis: Rebound from the Support line is possible.
Being on the gainer’s list today Bitcoin price retested the $62000 mark. The analysis shows how bitcoin previously broke downward of the falling wedge pattern and found support at $59,236. BTC price today has shown a brave recovery in this turbulence and is trading above the long strong support zone of $60K.
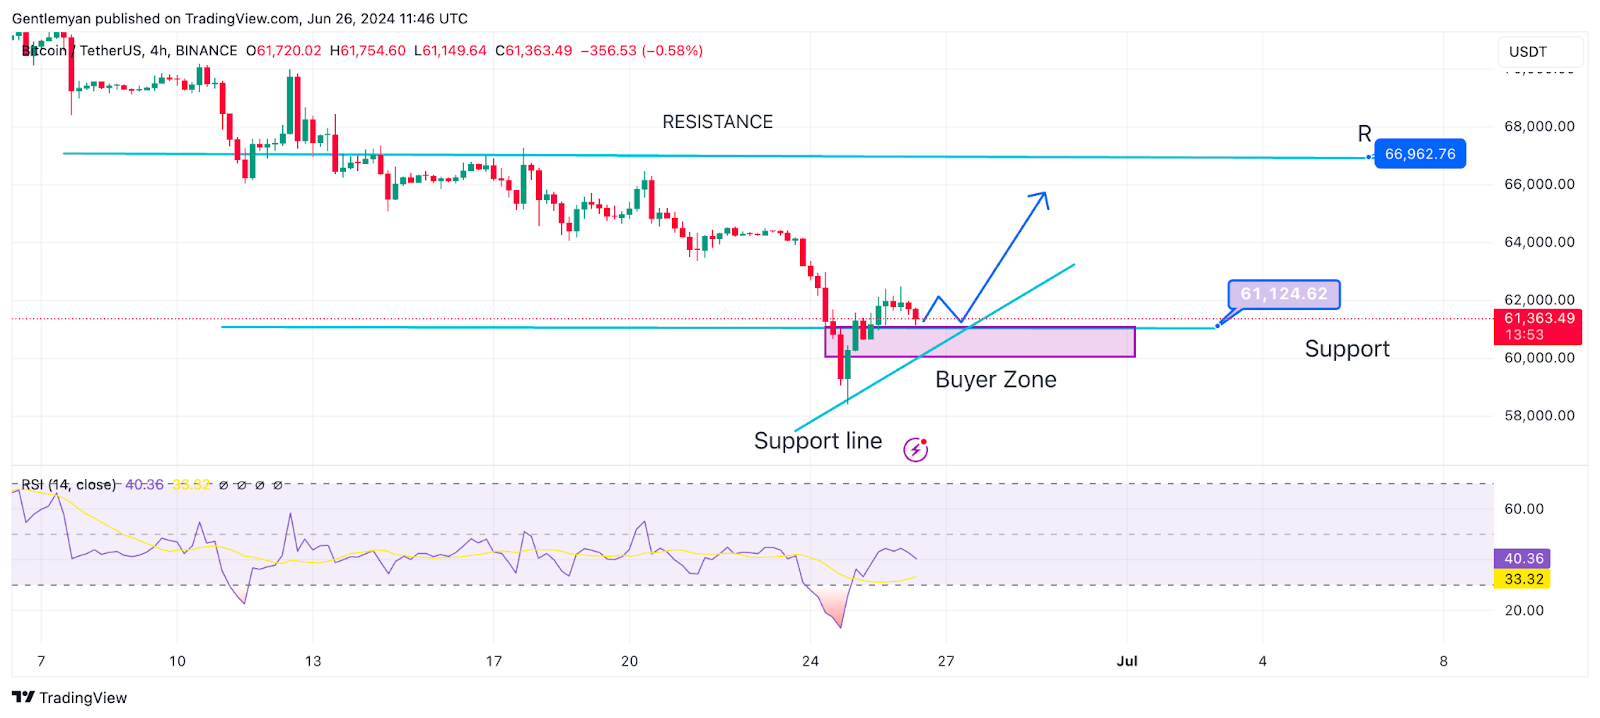
The RSI is neutral with a downward direction, creating room for more consolidation without being oversold. BTC rebounded even after breaching the support zone, and now trading above the zone. This suggests a trend reversal as the accumulation can start anytime to rebound to $65,500.
BTC Currently trading at $61,344
Ethereum (ETH) Analysis: Bears Still Awake
Ethereum price today is on the gainer’s list, but the trend remains bearish for the altcoin. The chart reveals ETH price in line with the middle line of the Bollinger bands which indicates more consolidations in place. With Bollinger bands not so wide, they also indicate a low volatility.
RSI at 43 is in a neutral zone with no overbought or oversold condition, but there is still room to accommodate the consolidation phase. A Strong reversal above $3500 is required to hold the trend, else the price may correct for a few more sessions.
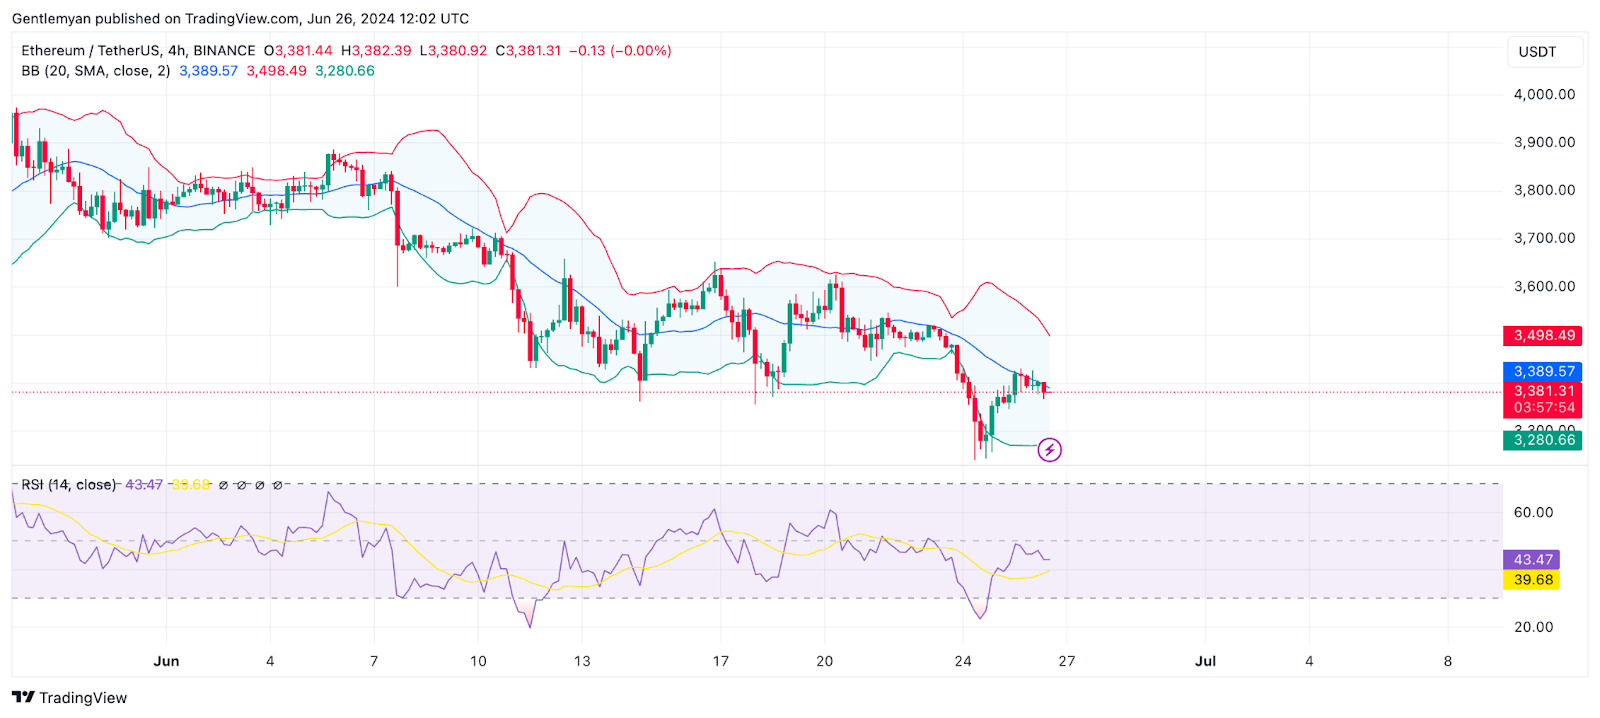
Ethereum ETH Currently Trading $3,385
Fetch ai (FET) Analysis: A Bullish trend Expected
Fetch ai (FET) makes its place in the top gainers today with 24 24-hour spikes of 4.30%, but the volume is done to 20%. As Seen in the chart the Alligator Indicator shows an alligator opening mouth pattern, with a green line on top, then red, and then blue. This formation is a clear indication of the continuous bullish trend.
The MFI Indicator at 70 is hanging near the overbought territory, a potential pullback after a few more green candles can be seen, Or this can also be a consolidation phase before the upward movement.
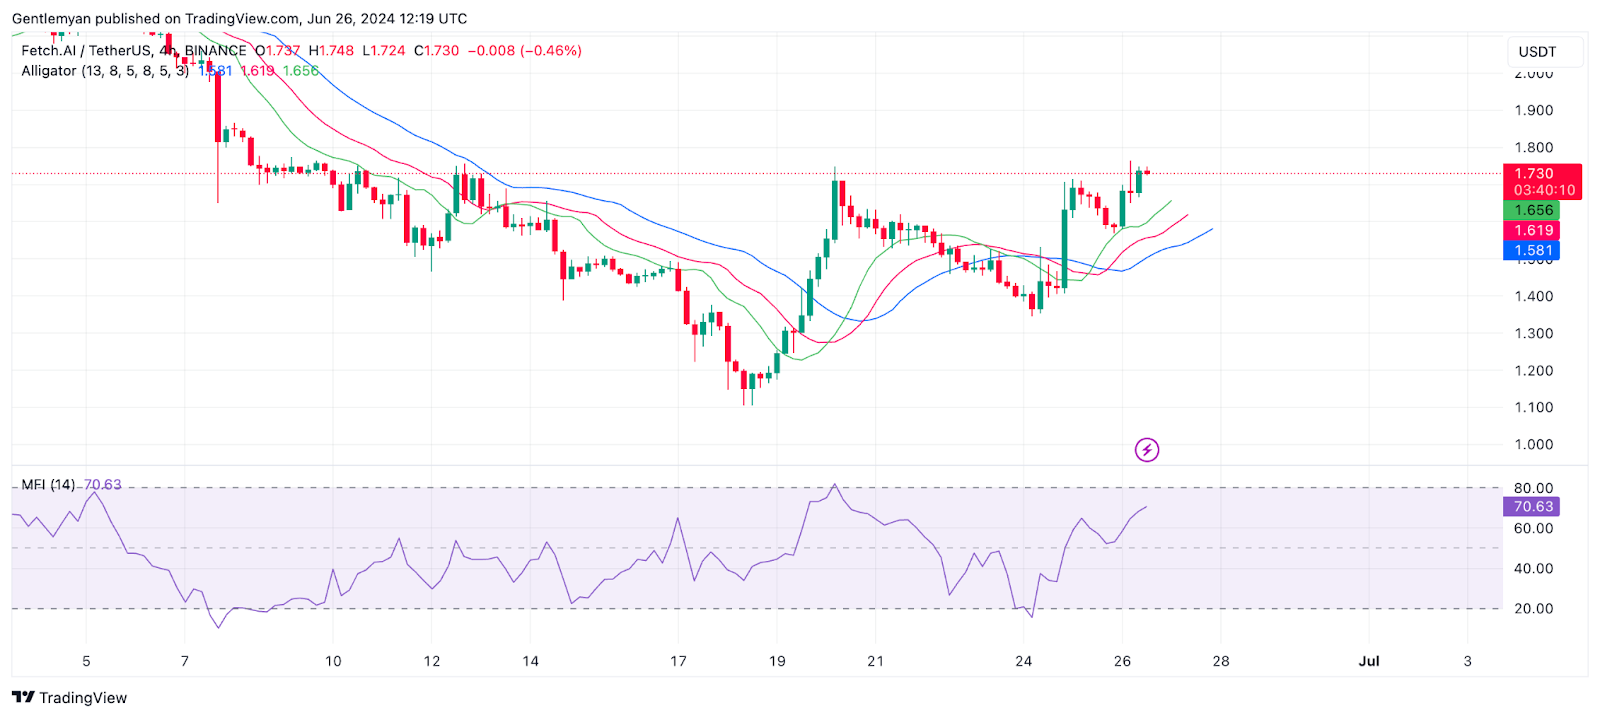
Fetch Currently trading at $1.73
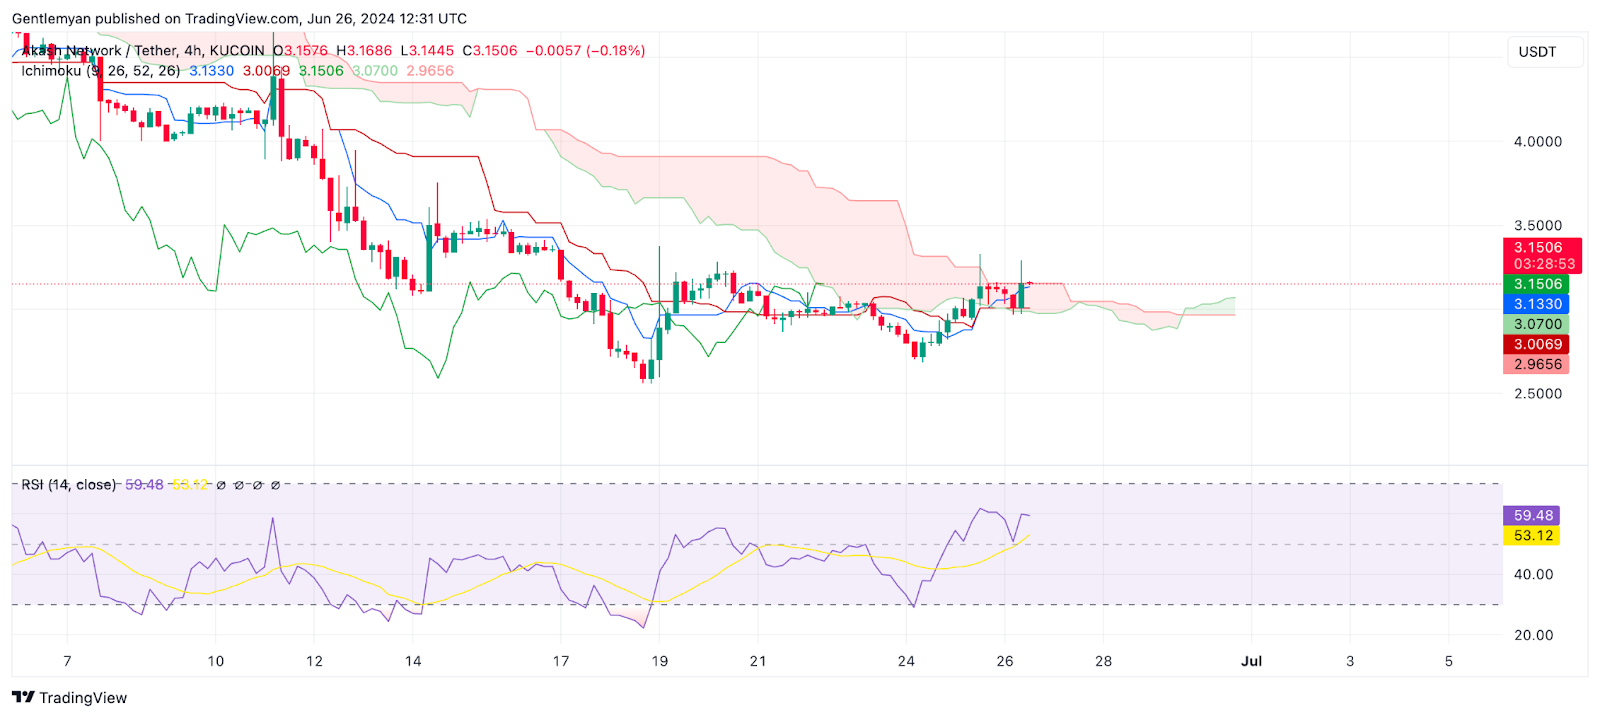
Akash Network (AKT) Price Analysis: Bullish, But Weak
Akash Network (AKT) is among the top gainers too with a 24-hour change of 4.27% and a 100% rise in volume. In the Chart analysis, the applied indicator Ichimoku Cloud represents price trading inside the cloud near to above the cloud, this represents a continuation of an upward trend.
AKT RSI is at 59 holds room for price more accumulation without entering the overbought zone.
SingularityNET (AGIX) Analysis
SingularityNET (AGIX) this week has shown resilience by rejecting downward momentum at $0.466 and rising upward with a weekly high of 29% and 3.5% in 24 hours. Currently Tradinf at $0.716 the AGIX/USDT Chart shows how the Trens line breakout is done. This indicates a bullish trend.
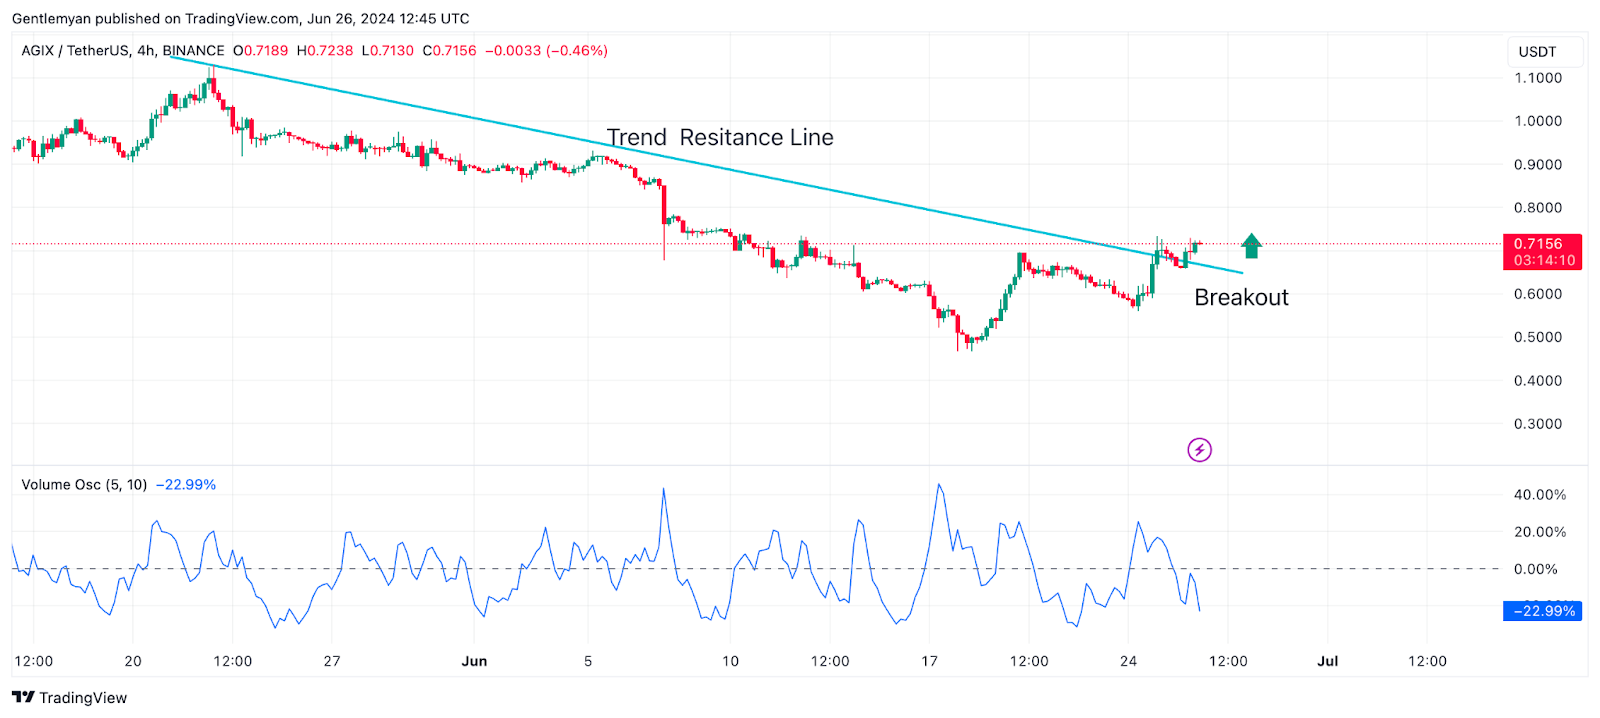
However, the decreasing volume oscillator raises concerns about the trend continuation, as it registers an increased selling pressure. If the pressure reduces the price will pump above $0.9 soon.
